<?xml version="1.0" encoding="utf-8"?><feed xmlns="http://www.w3.org/2005/Atom" xml:lang="en"><generator uri="https://jekyllrb.com/" version="3.10.0">Jekyll</generator><link href="https://ccc909.github.io/feed.xml" rel="self" type="application/atom+xml" /><link href="https://ccc909.github.io/" rel="alternate" type="text/html" hreflang="en" /><updated>2026-08-23T18:12:08+00:00</updated><id>https://ccc909.github.io/feed.xml</id><title type="html">ccc909’s Blog</title><subtitle>ccc909&apos;s write-ups. A survey of GraphQL on the top million domains; the Glico-Morinaga case tested on 1984 Tokyo Stock Exchange data; more when it&apos;s done.</subtitle><author><name>ccc909</name></author><entry><title type="html">The Monster Never Sold Short? The Monster with 21 Faces and the stock market</title><link href="https://ccc909.github.io/2026/08/20/the-monster-never-sold-short/" rel="alternate" type="text/html" title="The Monster Never Sold Short? The Monster with 21 Faces and the stock market" /><published>2026-08-20T00:00:00+00:00</published><updated>2026-08-22T00:00:00+00:00</updated><id>https://ccc909.github.io/2026/08/20/the-monster-never-sold-short</id><content type="html" xml:base="https://ccc909.github.io/2026/08/20/the-monster-never-sold-short/"><![CDATA[<figure class="float-right" style="float:right; width:36%; margin:0.2em 0 1em 1.6em;">
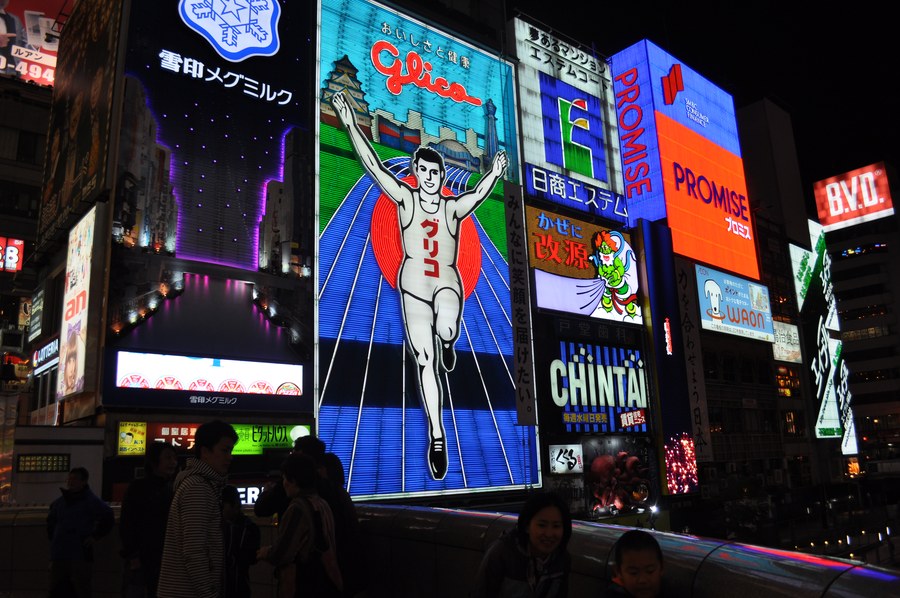
  <img src="/assets/glico/case/02_glico_sign_dotonbori.jpg" alt="The Glico running man sign over Dotonbori, Osaka, at night" width="900" height="598" style="width:100%;" />
  <figcaption>Glico's running man over Dotonbori, Osaka. The company's president was taken from his home in March 1984. Photo: Schellack, 2013, CC BY-SA 3.0.</figcaption>
</figure>

<p>In March 1984, masked men broke into the home of the president of Ezaki Glico,
the candy company, and took him out of his bath at gunpoint. He escaped after
three days.<sup id="fnref:1" role="doc-noteref"><a href="#fn:1" class="footnote" rel="footnote">1</a></sup> Then Glico warehouses started burning, and letters started arriving
at newspapers, signed かい人21面相, “the Monster with 21 Faces,” a villain
borrowed from prewar detective novels.<sup id="fnref:2" role="doc-noteref"><a href="#fn:2" class="footnote" rel="footnote">2</a></sup> Over the next year and a half the group
extorted most of the Japanese confectionery industry. They put cyanide-laced
candy on store shelves, some of it with a note on the package reading “danger:
poison inside, you’ll die if you eat this.” They taunted the police by name;
“a fool stays a fool however hard he tries,” one letter to the newspapers said
of the investigators. They demanded ¥50 million here, ¥100 million there, at
one point ¥1 billion plus 100 kilograms of gold.</p>

<p>They never collected any of it. Every ransom drop failed or was abandoned. In
August 1985 they mailed a farewell letter, “we’re done bullying food
companies,” and disappeared. Nobody was ever charged. The statute of
limitations ran out in 2000.<sup id="fnref:3" role="doc-noteref"><a href="#fn:3" class="footnote" rel="footnote">3</a></sup></p>

<p>A crime this elaborate with no visible payout needs an explanation, and there’s
a popular one: the ransoms were theater, and the real money was made on the
stock exchange. Sell the victims’ shares short, poison the candy, collect. The
police took this seriously enough at the time to investigate speculator groups.
Victim stocks really did fall. Morinaga dropped about 8% when the poisonings
went public and kept sliding.<sup id="fnref:4" role="doc-noteref"><a href="#fn:4" class="footnote" rel="footnote">4</a></sup> It’s a tidy theory, it has been repeated for
forty years, and as far as I can tell nobody has checked it against market
data. The police came closest. In 1984 they canvassed the victim companies, the
brokers and the exchange itself, ran into broker confidentiality, and named one
suspect, a Tokyo speculator group called Video Seller, which Kabutocho had
nicknamed “the stock market’s Monster with 21 Faces.” Its chairman turned up
dead two months after the case ended, and there were no charges and no
decisive evidence.<sup id="fnref:5" role="doc-noteref"><a href="#fn:5" class="footnote" rel="footnote">5</a></sup> Since then the theory has lived in investigative books
(Fumiya Ichihashi’s, and a more sophisticated version from the writer Manabu
Miyazaki, who was himself a suspect), in a 2016 novel and its film, and in a
2025 business-magazine chart of how Glico’s and Morinaga’s share prices moved.
None of them tested it.<sup id="fnref:6" role="doc-noteref"><a href="#fn:6" class="footnote" rel="footnote">6</a></sup> The ones that cite a number all cite the same one, a
24% drop in Glico’s stock between January and May 1984, which happened in full
public view and proves nothing about foreknowledge.<sup id="fnref:7" role="doc-noteref"><a href="#fn:7" class="footnote" rel="footnote">7</a></sup></p>

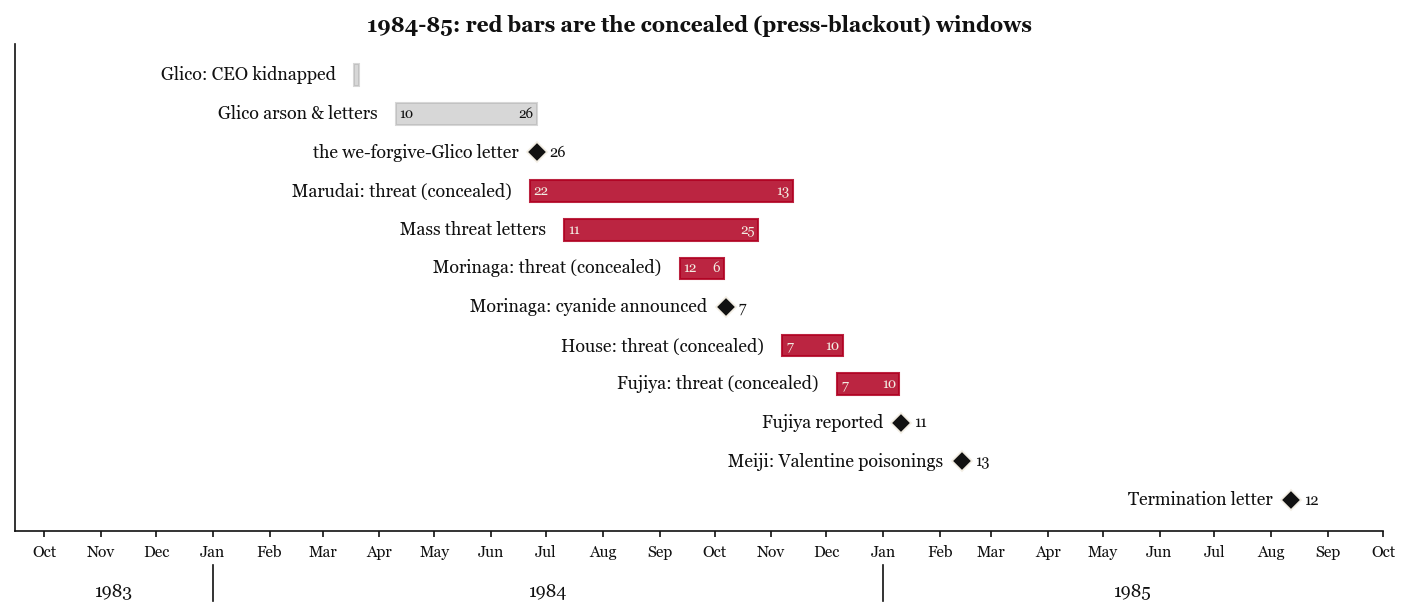
<p>There’s a reason it’s checkable at all, and it’s a detail of how Japanese media
handled the case. Several of the extortions were kept out of the press entirely
while negotiations ran. Marudai Foods was threatened in June 1984 and the public
learned about it in November. House Foods was threatened in November, reported
in December. Fujiya in December, reported the following January. During those
blackout windows the threat was known to the company, the police, a few editors,
and the criminals. If somebody shorted Marudai in July 1984, they either got
very lucky or they were standing very close to the crime.</p>

<p><img src="/assets/glico/timeline.png" alt="Timeline of the campaign, concealed windows in red" width="1410" height="615" loading="lazy" /></p>

<p>The short answer is that nothing moved in any of those windows. The rest of
this post is how I know that, and then the one thing in two years of data that
did move, which turned out to have nothing to do with the crime.</p>

<h2 id="the-data-problem">The data problem</h2>

<figure class="float-right" style="float:right; width:30%; margin:0.2em 0 1em 1.6em;">
  <img src="/assets/glico/case/01_kabutocho_1937.jpg" alt="The Tokyo Stock Exchange at Kabutocho, woodblock print, 1937" width="678" height="900" style="width:100%;" loading="lazy" />
  <figcaption>The exchange at Kabutocho in a 1937 woodblock print by Koizumi Kishio (public domain). The daily bulletin was the exchange's own paperwork.</figcaption>
</figure>

<p>There is no clean dataset of daily Japanese stock prices from 1984, no API, no
vendor file worth having. What exists is the Tokyo Stock Exchange’s own daily
bulletin (東京証券取引所日報), which JPX has scanned and put online as monthly zip
files of TIFFs.<sup id="fnref:8" role="doc-noteref"><a href="#fn:8" class="footnote" rel="footnote">8</a></sup> One multi-page scan per trading day, roughly 4700x6500 pixels
per page, black and white, photographed from what are clearly the exchange’s
bound file copies. Some pages have handwritten corrections in the margins from
whoever kept the files in 1984. I’ll call each scanned page a plate. That is
what it is, a photograph of one printed sheet, and the rest of this post is
about getting numbers off them.</p>

<p>I pulled the 24 months covering 1984 and 1985: 572 trading days, about 2.5 GB of
TIFFs. Each day is 16 pages. Pages 1-8 are the price tables for every listed
stock. Pages 12-15 are the convertible bond market. And page 16 is where the
exchange printed its surveillance of its own market: per-stock margin balances,
the list of stocks under restriction, and a small table of stock-lending fees.</p>

<p>You don’t need Japanese to follow what comes next, but you do need five pieces
of market plumbing, because the whole argument runs through them.</p>

<h2 id="a-short-primer-on-the-1984-tokyo-market">A short primer on the 1984 Tokyo market</h2>

<p><strong>Securities codes.</strong> Every listed company has a four-digit number, grouped by
industry. Foods are the 2000s: Morinaga is 2201, Fujiya 2211, Marudai 2288,
House 2810, Glico 2206.<sup id="fnref:9" role="doc-noteref"><a href="#fn:9" class="footnote" rel="footnote">9</a></sup> The bulletin sorts by code everywhere, which matters
more than it sounds, because position in a sorted list identifies a company
even when its name is an unreadable smudge.</p>

<p><strong>Two sessions a day.</strong> The exchange closed for lunch. Every stock got a
morning session and an afternoon session, each with its own open, high, low and
close, and the bulletin prints all eight numbers.<sup id="fnref:10" role="doc-noteref"><a href="#fn:10" class="footnote" rel="footnote">10</a></sup> It matters here because
someone acting on information received overnight has to queue an order for the
morning open, so that is where informed trading would show up.</p>

<p><strong>Margin trading.</strong> Investors could buy, or sell short, on credit through a
broker. A margin short sells borrowed shares. For any stock it was keeping an
eye on, the exchange published the outstanding balances: shares currently sold
short (the short balance) and shares held long on credit (the long balance),
in thousands of shares, updated daily.<sup id="fnref:11" role="doc-noteref"><a href="#fn:11" class="footnote" rel="footnote">11</a></sup></p>

<p><strong>Stock lending, and the fee.</strong> A short seller’s borrowed shares come from a
securities finance company, which sources them mostly out of the margin longs.
Only stocks on an approved list could be borrowed this way; the bulletin marks
them with a dot next to the name. When the shorts in a stock borrowed more than
the finance company could supply, there was a borrow shortage, and an auction
was held to find the rest. Most days the shortage cleared at zero. When it
didn’t, the shorts paid a fee per share per day, quoted in sen, 100 sen to the
yen, which traders call “reverse daily interest.”<sup id="fnref:12" role="doc-noteref"><a href="#fn:12" class="footnote" rel="footnote">12</a></sup> A positive fee means the
short side of that stock was crowded past what the market could lend.</p>

<p><strong>The watch list and emergency rules.</strong> The exchange published which stocks it
had under surveillance for speculative trading, and when things got out of hand
it raised the collateral required to trade them on margin. Both sit on the
same page as the lending fees.<sup id="fnref:13" role="doc-noteref"><a href="#fn:13" class="footnote" rel="footnote">13</a></sup></p>

<h2 id="five-things-you-can-measure-and-what-a-crime-would-look-like-in-each">Five things you can measure, and what a crime would look like in each</h2>

<p>If somebody shorted a victim company knowing an extortion was coming, here is
what each instrument the bulletin supports would show:</p>

<ol>
  <li><strong>Prices.</strong> The target underperforms its sector during the concealed window
as the selling leaks into the price. Daily closes, adjusted against the
other food stocks.</li>
  <li><strong>Sessions.</strong> That underperformance loads on the morning session, because
overnight information gets acted on at the open.</li>
  <li><strong>Volume.</strong> Unusual turnover while the position is built.</li>
  <li><strong>Margin balances.</strong> The target’s short balance climbs through the window.
This is the most direct record there is: a count of shares sold short.</li>
  <li><strong>The borrow.</strong> The target appears in the borrow-shortage list, and if the
position is big enough, starts paying a fee. The list is binary, a stock is
on it that day or it isn’t, which makes it the cleanest of the five.</li>
</ol>

<p>A sixth, the convertible bond market, gets its own test later, because it
allowed a trade the other five cannot see.</p>

<p>Before trusting any of them I planted fake signals in the real data (a
synthetic daily drag on one stock, a volume spike, a run of borrow-shortage
days) and checked that each instrument found its fake. Where an instrument
failed to find its fake, the corresponding result below is marked as
inconclusive.</p>

<h2 id="reading-the-pages">Reading the pages</h2>

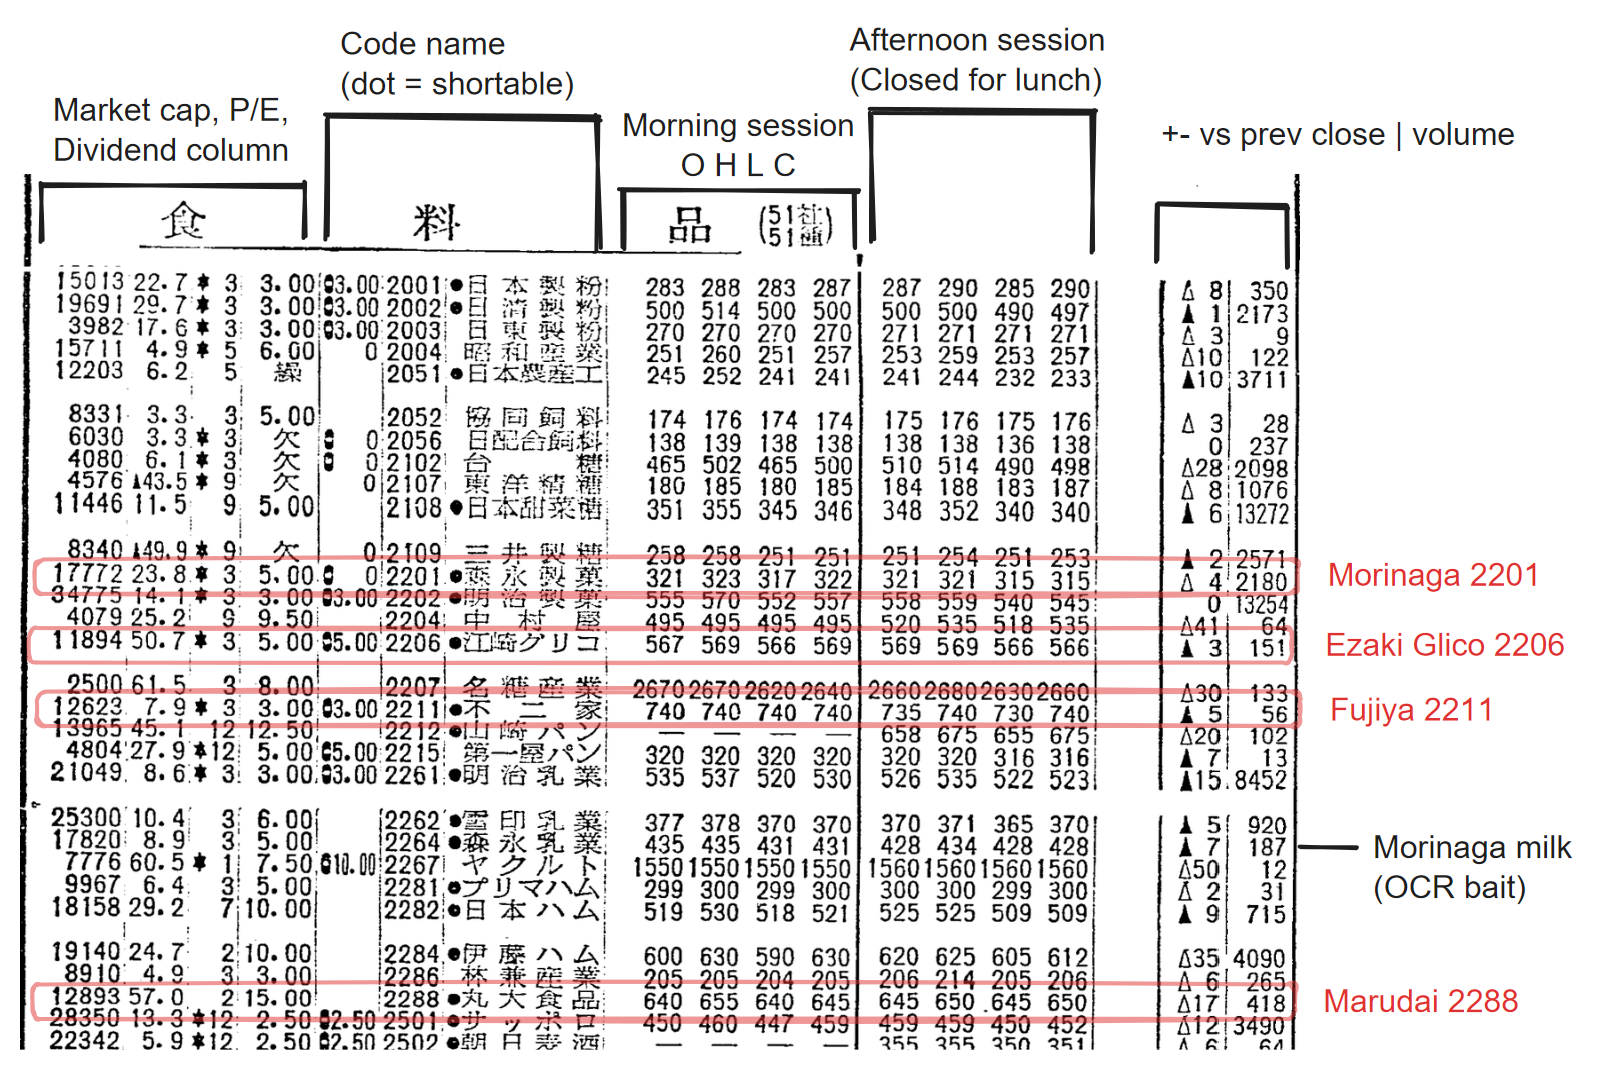
<p>The price pages first. This is the foods section on June 20, 1984, two days
before the Marudai letter, with four of the five companies in the case boxed
(House Foods, 2810, sits further down the section):</p>

<p><img src="/assets/glico/anno_pricepage.png" alt="The food section of the price pages, annotated" width="1598" height="1071" loading="lazy" /></p>

<p>One stock per row. Size and valuation columns on the left (capital, P/E,
dividend), then the code, then the name with a dot if the stock is loanable and
therefore shortable, then the eight prices, morning and afternoon, then the
change against the previous close with a triangle for direction, then volume.
Every extortion target has the dot. One trap, labeled in black: Morinaga Milk
(2264) is a different listed company from Morinaga the candy maker (2201), four
rows apart, and both OCR and I confused the two at first.</p>

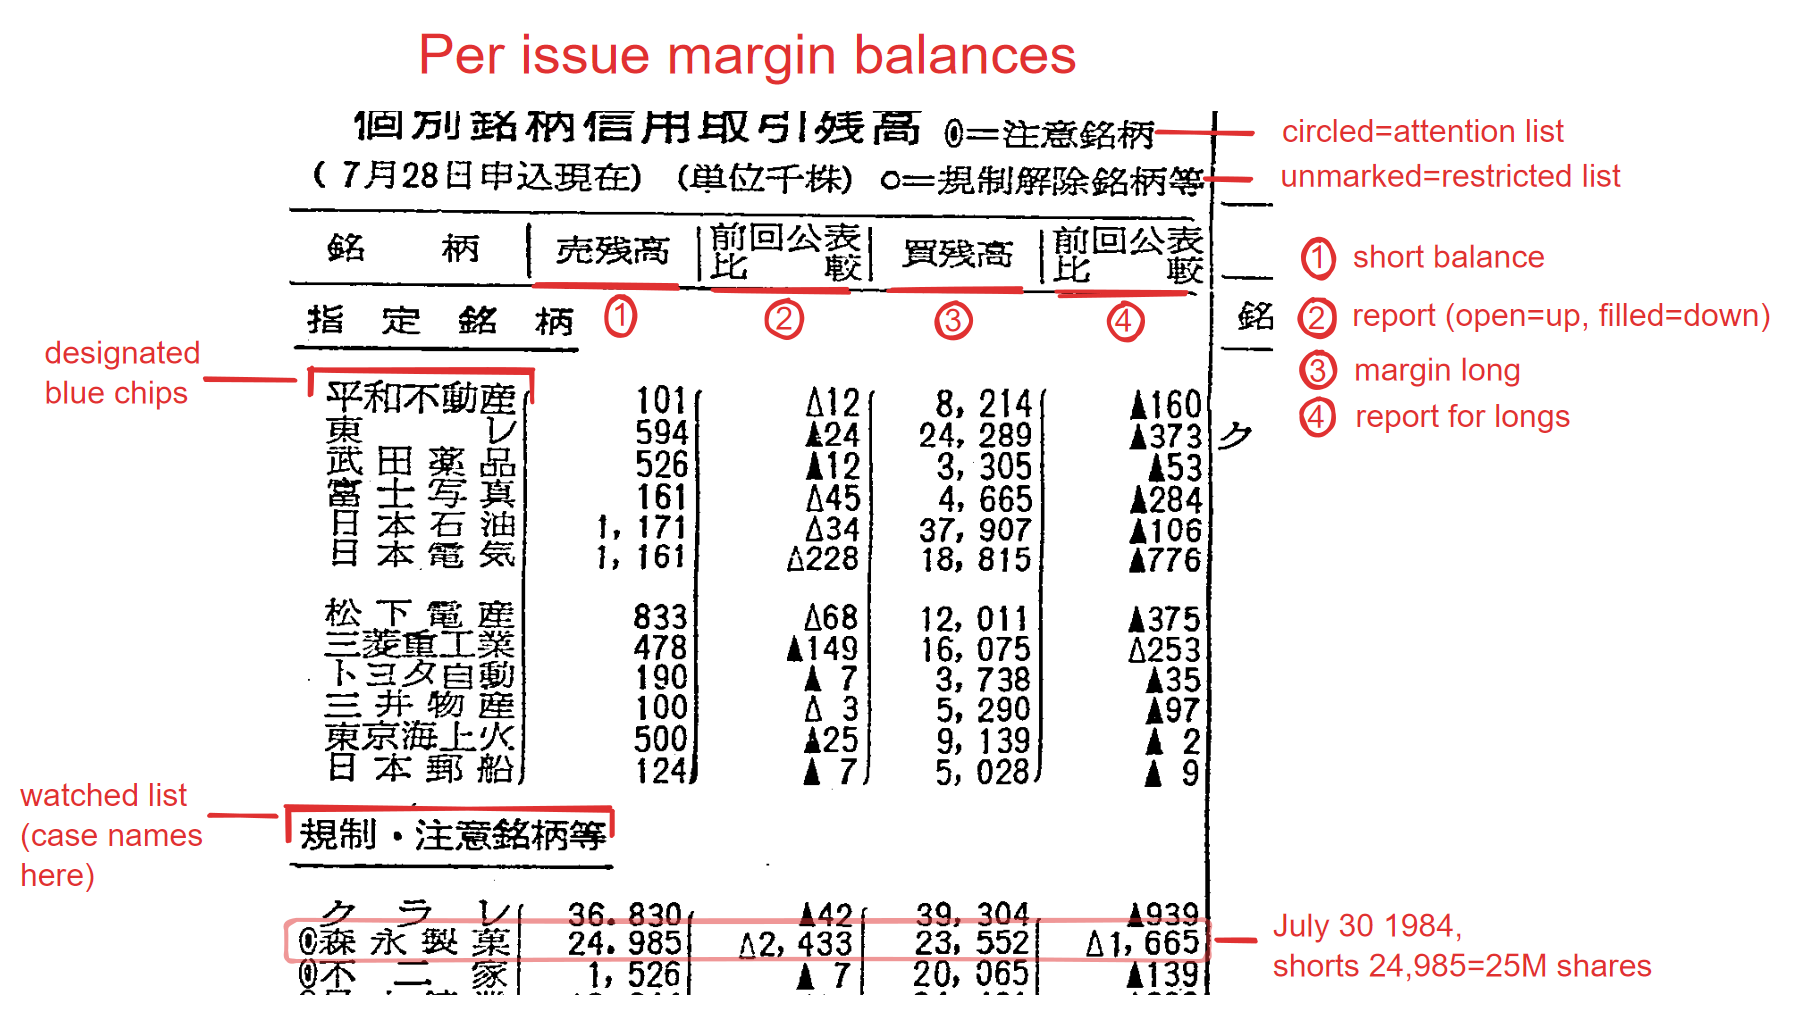
<p>Page 16 next, where the exchange watches its own market. The margin table:</p>

<p><img src="/assets/glico/anno_margin.png" alt="The per-issue margin balance table, annotated" width="1808" height="1015" loading="lazy" /></p>

<p>For each stock under surveillance: the short balance, the change since the
last report, the long balance, and its change, all in thousands of shares. The
triangles give direction, open for up and filled for down. The day shown is
July 30, 1984, and Morinaga’s short balance is up 2.4 million shares in a
single report. That is the tail end of a squeeze in Morinaga’s stock that
summer. It has no connection to the extortion letter, which was still six
weeks away; it gets its own section further down.</p>

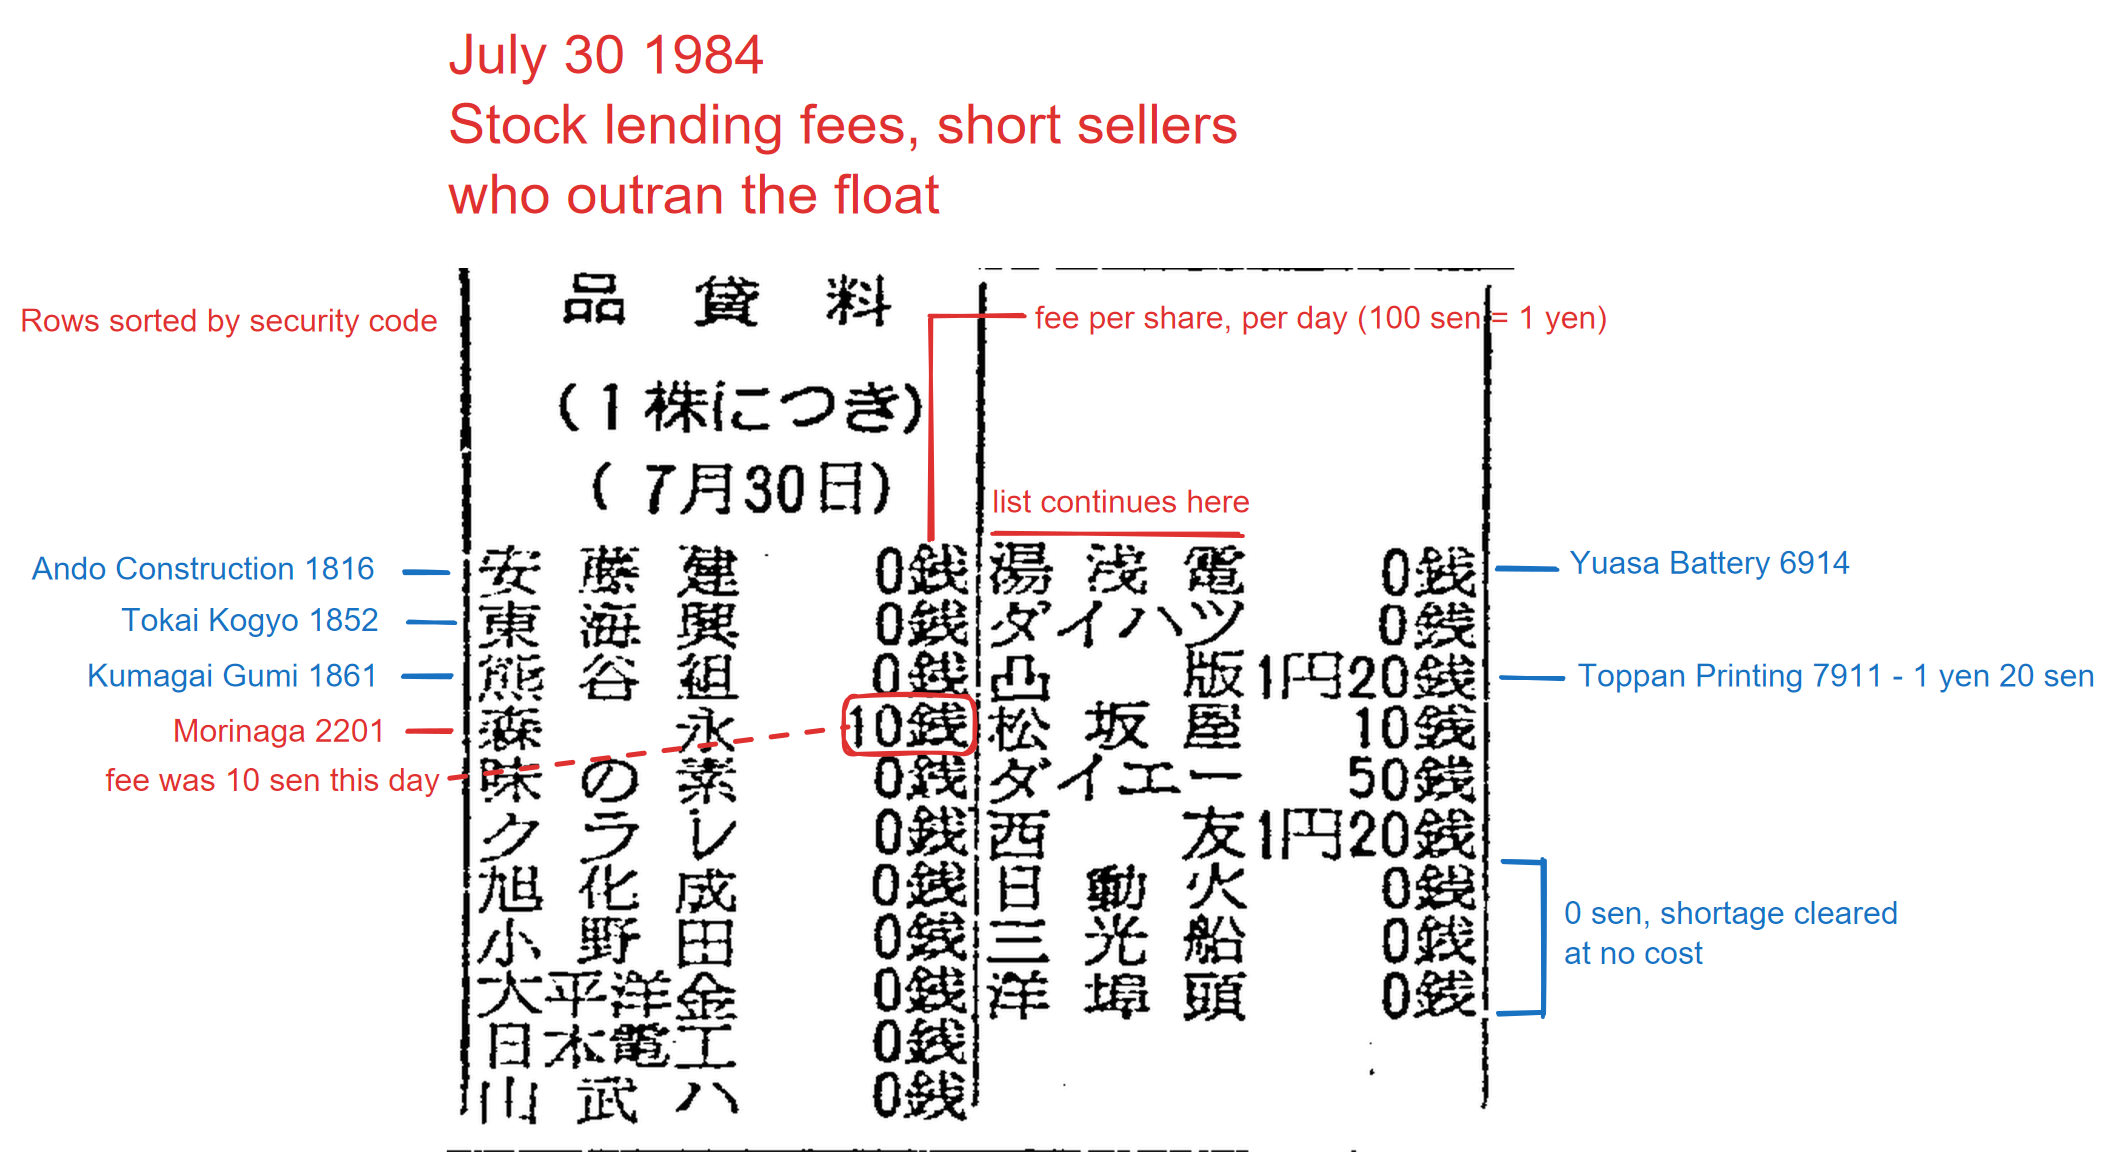
<p>Now the lending-fee table:</p>

<p><img src="/assets/glico/anno_shinagashi.png" alt="The stock-lending fee table, annotated" width="2128" height="1172" loading="lazy" /></p>

<p>The names run left to right across a fixed-width field, so a two-character
name has a gap in the middle, and the rows are sorted by code. Codes aren’t
printed, but position identifies names: the construction companies in the
1800s come first, then Morinaga (2201), and Fujiya (2211) can only ever sit one
or two rows below it. I used that structure to check every name match.</p>

<p>A stock appears here at all only when its short sellers borrowed more than the
finance company could supply that day: it is the day’s list of stocks where the
short side outran the lendable float. 0 sen means the shortage cleared free. A
positive fee, like Morinaga’s 10 sen here, means the shorts were crowded enough
that lenders charged for the privilege. The right-hand column of the same day
shows the range: Toppan and Seiyu at 1 yen 20 sen, Daiei at 50 sen. Morinaga’s
10 sen sits at the low end of it.</p>

<p>This table matters more than the prices. Price-based tests have a noise floor:
a modest trade hides inside ordinary volatility and you can never prove it
isn’t there. A borrow shortage either happened on a given day or it didn’t, and
the exchange printed which, every day, for two years.</p>

<p>One more table:</p>

<p><img src="/assets/glico/anno_kisei.png" alt="The margin restriction table, annotated" width="1595" height="1101" loading="lazy" /></p>

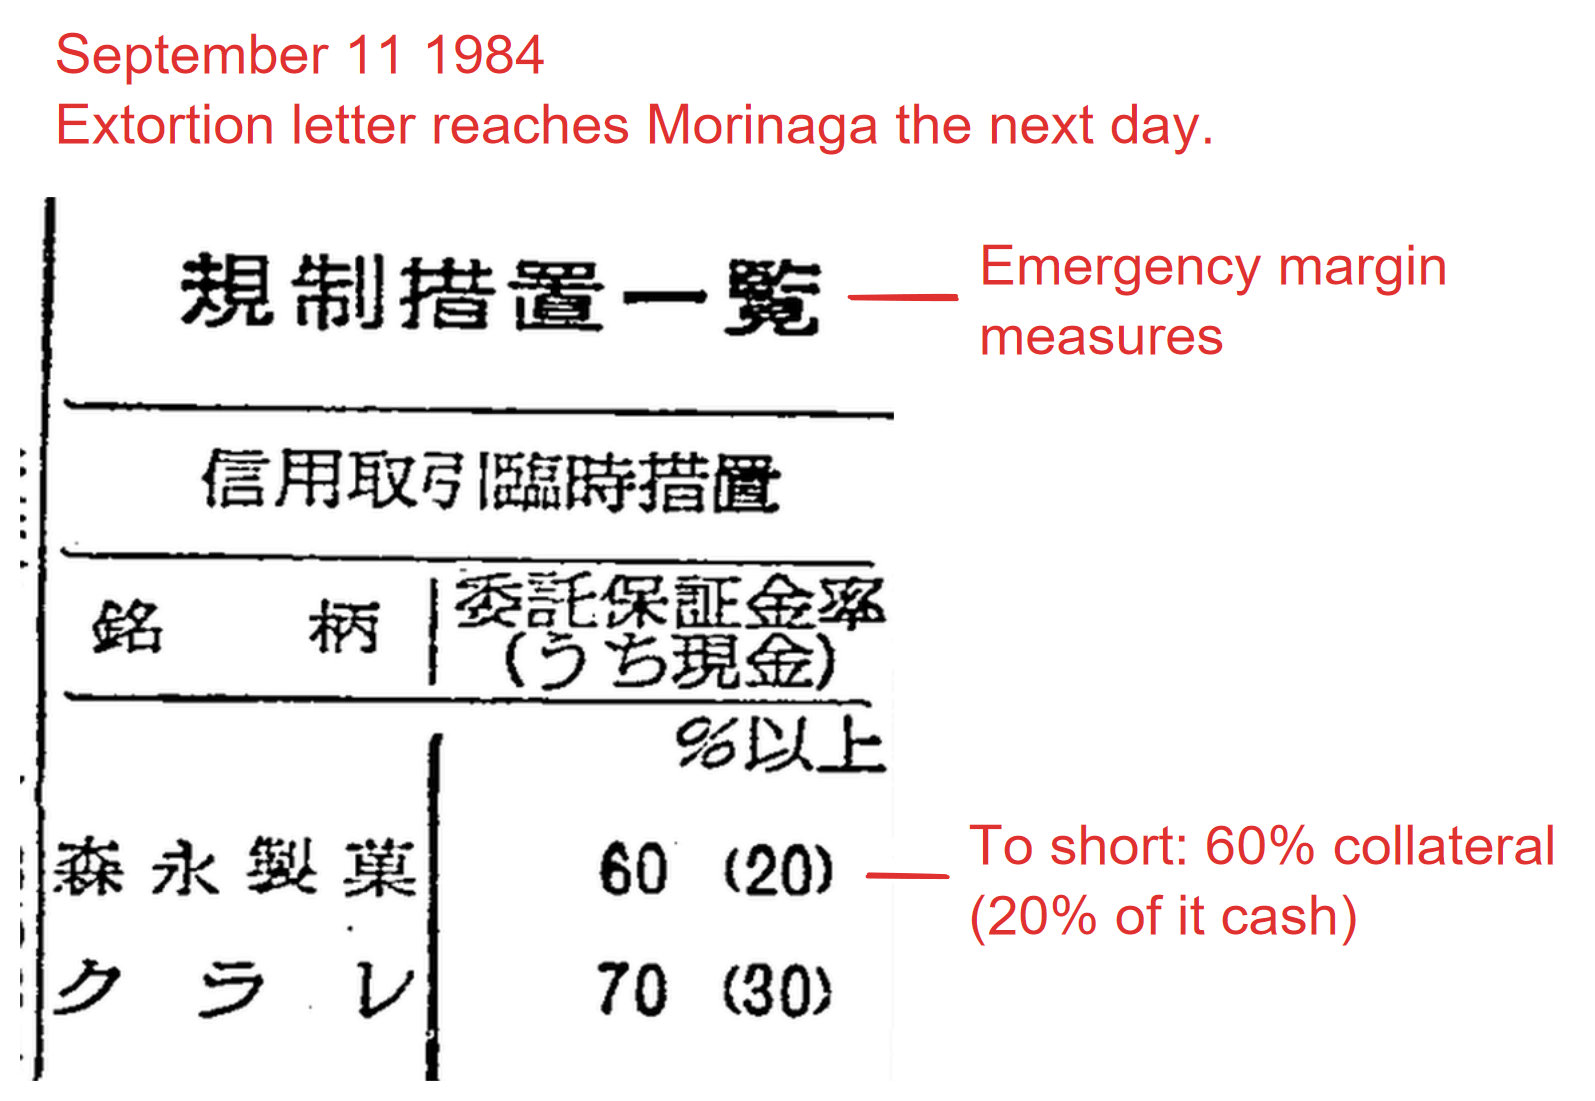
<p>Emergency margin measures: 60% collateral, 20% of it cash, to short Morinaga.
Printed September 11, 1984. The extortion letter reached Morinaga’s Kansai
office on September 12.<sup id="fnref:14" role="doc-noteref"><a href="#fn:14" class="footnote" rel="footnote">14</a></sup> So the exchange had already clamped the stock the
day before the letter arrived; it was reacting to the July squeeze, not to
anything the criminals did.</p>

<h2 id="getting-numbers-out-of-the-scans">Getting numbers out of the scans</h2>

<figure class="float-left" style="float:left; width:46%; margin:0.2em 1.6em 1em 0;">
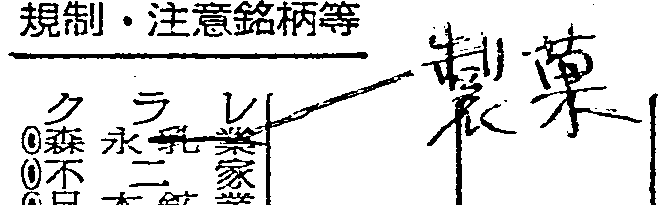
  <img src="/assets/glico/margin_note.png" alt="Handwritten correction in the margin of the July 28, 1984 margin table" width="660" height="205" style="width:100%;" loading="lazy" />
  <figcaption>July 28, 1984, the exchange's file copy. Morinaga had entered the watch list the day before and the bulletin printed the wrong Morinaga, the dairy company. Someone at the exchange struck it out and wrote the candy maker's name in the margin. The balances on the following days prove the clerk right.</figcaption>
</figure>

<p>Off-the-shelf OCR is useless on these. Tesseract’s Japanese model reads
Morinaga’s name as a different set of characters entirely and invents digits in
the price columns. What worked: find each table by template-matching its
printed banner, find the columns from the ink itself, cut individual cells, and
read the numeric cells with TrOCR on a GPU, which handles degraded print far
better than classical OCR.<sup id="fnref:15" role="doc-noteref"><a href="#fn:15" class="footnote" rel="footnote">15</a></sup> Company names never go through OCR at all; they’re
matched against reference cut-outs of the printed names and checked against
the code ordering, and in stubborn cases I read them off magnified crops
myself. The margin balances for the two targets the exchange printed them for,
47 days for Morinaga and 65 for Fujiya, I transcribed by eye.</p>

<p>Even the good OCR output was junk at first. When I computed daily returns from
the raw reads, over 90% of the variance was transcription error. A stock closes
at 520, the 5 reads as 3, and you’ve invented a 38% crash. So every price goes
through a repair layer that models each stock as a slowly moving level and
rejects cells that don’t reconcile with it. The convertible bond pages, which
print each bond’s parity, give an independent check on a different page of the
same paper: where both survive, 83% of the pairs agree within 3%, and the
typical gap is a fraction of a percent.</p>

<p>That check still runs my own pixels through my own code. A better one uses
data I never touched. The Nikkei 225 daily index for 1984-85 is freely
available from FRED, and it has nothing to do with any of this: different
institution, different index, digitized decades apart from my scans.<sup id="fnref:16" role="doc-noteref"><a href="#fn:16" class="footnote" rel="footnote">16</a></sup> If my
food stocks are real, their daily moves have to covary with the market. Built
from raw OCR, an index of my food stocks has a daily standard deviation of 44%,
fifty times that of a real index, and a correlation with the Nikkei of 0.076.
Run the same construction on the repaired data and it becomes a 0.61% daily
standard deviation (the Nikkei’s own is 0.80%), correlation 0.505, and a market
beta of 0.384, which is about what a defensive food sector should have. On the
five worst days the Nikkei had that year my food index is down every time; on
the five best it is up by much less, the way defensive sectors behave. Shuffle
the dates and the correlation collapses to zero. How good the numbers are is
measured in the appendix, against 33 plates I read by eye. The short version:
the raw extractor gets 89% of cells right; the repair layer keeps about half
the weekday closes, and 97.5% of what it keeps matches the plate exactly; a
single stock’s daily returns carry at most about 1.1% of noise, and the tests
below were sized to see through that.</p>

<p>One more thing about method, because everything below is a negative result,
and negative results are easy to fake. Several times during this work a
finding looked real and died on inspection. The clearest case was House Foods’
morning session. The price tests showed House underperforming in
the morning sessions of its concealed window at p=0.011, roughly a
one-in-ninety chance of arising by luck, exactly what an overnight-informed
seller should produce. It held up until I looked at which days were in the
window: it included December 11, the day the press blackout on House lifted,
and the morning selling was the public reacting to the news. Move the window
edge by one day and the result was gone. Everything below has been through
that kind of check, with the window edges fixed in advance.<sup id="fnref:17" role="doc-noteref"><a href="#fn:17" class="footnote" rel="footnote">17</a></sup></p>

<p>The data that came out of all this: daily prices and volume for about 50
food-sector stocks plus a machinery-sector control group, 1981 to 1985; morning
and afternoon session returns for 1984; margin balances for Morinaga and
Fujiya; the convertible bond market; and the full borrow-shortage record, 472
published days, 14,737 entries, each tied to a name and a fee.</p>

<h2 id="what-the-theory-predicts-and-whats-actually-there">What the theory predicts, and what’s actually there</h2>

<figure class="float-right" style="float:right; width:20%; margin:0.2em 0 1em 1.6em;">
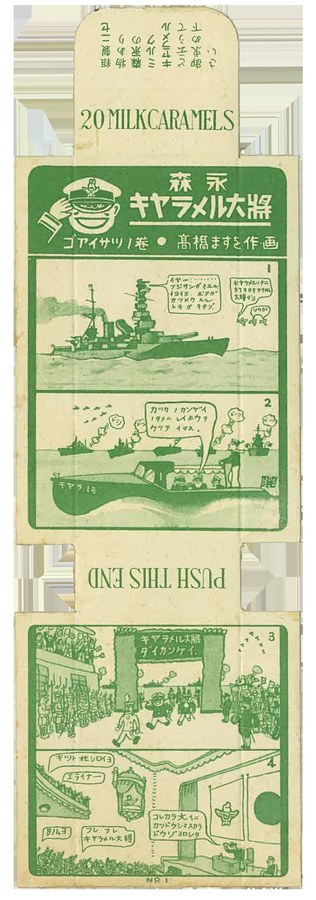
  <img src="/assets/glico/case/03_morinaga_caramel_1933.jpg" alt="A Morinaga Milk Caramel box from 1933, flattened" width="316" height="900" style="width:100%;" loading="lazy" />
  <figcaption>A Morinaga Milk Caramel box, 1933 (public domain). Fifty-one years later the company's chocolate was on shelves laced with cyanide.</figcaption>
</figure>

<p>If somebody traded on the concealed windows, the target should underperform the
other food stocks during the blackout, short interest should build, and the
borrow should tighten. None of that happens, in any of the windows, at any
strength the instruments can see.</p>

<p>Prices: each target against the other food stocks, through its own concealed
window, compared with random windows of the same length from the same stock’s
history. Marudai’s window is the long one, June to November, 53 usable trading
days, and it comes back flat with enough data to have detected a drag of 0.14%
per day. The morning-versus-afternoon split, which would catch someone queuing
orders overnight, is flat too. Pooling all the windows and hunting
aggressively, trying every defensible window edge, the best surviving result is
Morinaga’s autumn decline at p=0.09, roughly a one-in-eleven chance of showing
up by luck. The margin data explains that one.</p>

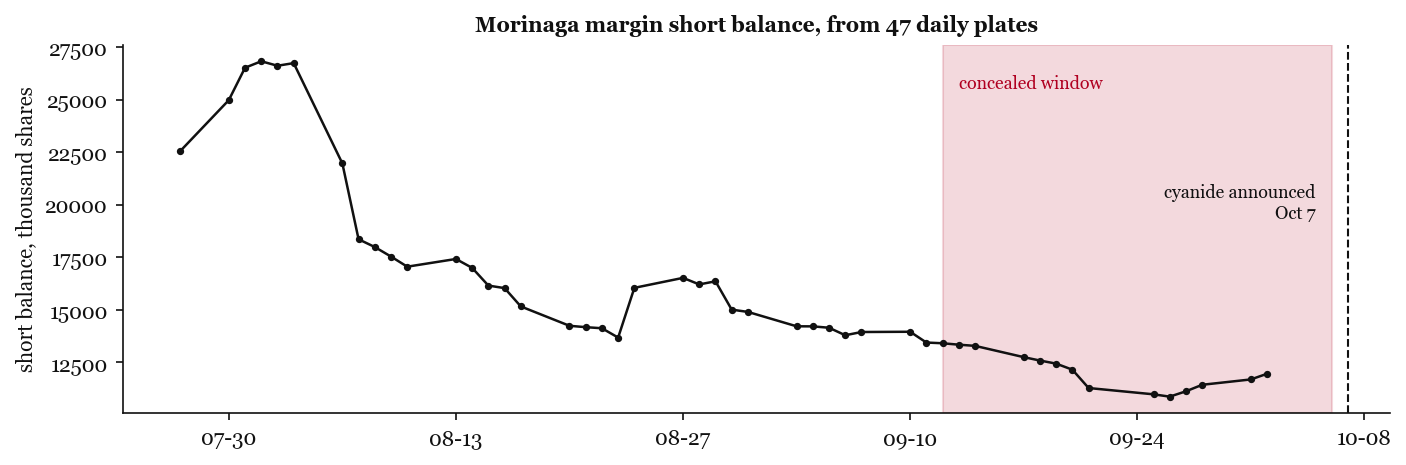
<p>Morinaga was under surveillance, so the exchange printed its short balance
daily. Through the concealed window, the weeks an informed short would be
building, Morinaga’s short interest was being covered, down from about 26.7
million shares in late July to 11 million by the day the poisonings went
public. That is the p=0.09: the stock drifting down while the shorts bought
back.</p>

<div style="clear:both;"></div>

<p><img src="/assets/glico/margin_unwind.png" alt="Morinaga margin short balance through 1984" width="1406" height="465" loading="lazy" /></p>

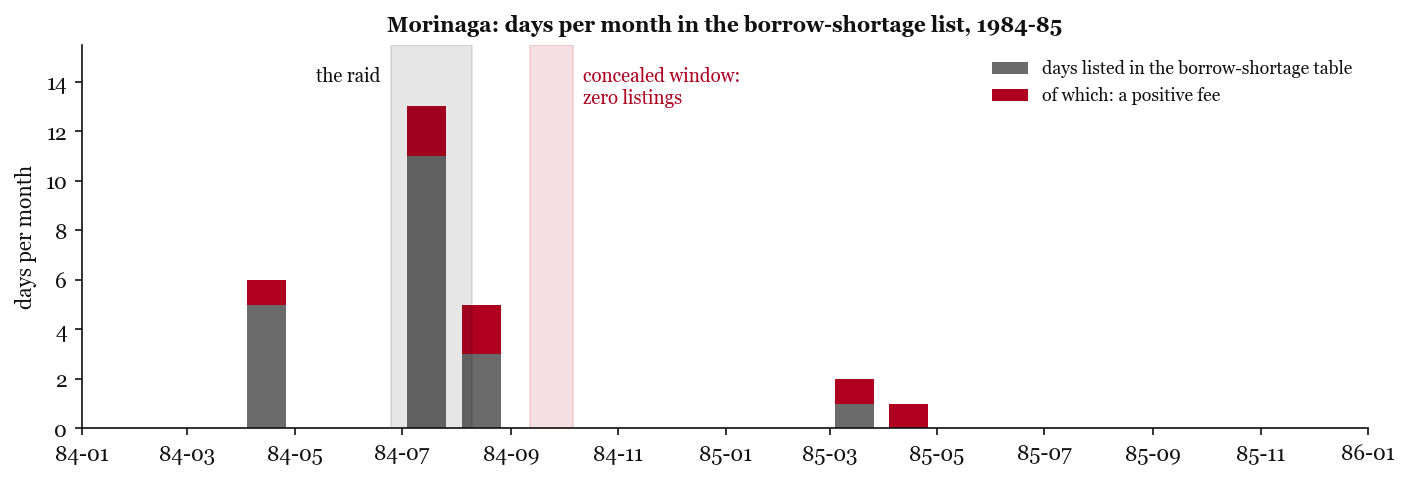
<p>Here is Morinaga’s complete two-year record in the lending-fee table, days
listed per month:</p>

<p><img src="/assets/glico/morinaga_borrow.png" alt="Morinaga in the borrow shortage list" width="1410" height="480" loading="lazy" /></p>

<p>Two things stand out. First, the instrument works. From July 12 to August 6,
1984, Morinaga was in borrow shortage on 17 of 23 sessions (13 of them in July)
with the fee going positive three times, the squeeze that earned it the 60%
margin requirement in the restriction table above. When shorts crowd this
stock, the table shows it and the regulator moves. Second, look at September
and October. The concealed window, September 12 to October 6, ending the day
before the cyanide announcement: zero appearances in 18 published sessions,
against about one expected from the stock’s own base rate, and the
planted-signal test says six would have been flagged. October after the
announcement: zero. November and December: zero.</p>

<figure class="float-left" style="float:left; width:34%; margin:0.2em 1.6em 1em 0;">
  <img src="/assets/glico/case/04_pekochan_fujiya.jpg" alt="Peko-chan at the door of a Fujiya shop" width="900" height="675" style="width:100%;" loading="lazy" />
  <figcaption>Peko-chan at the door of a Fujiya shop. Fujiya's threat was kept out of the press from December 1984 to January 1985. Photo: kcomiida, 2010, CC BY-SA 3.0.</figcaption>
</figure>

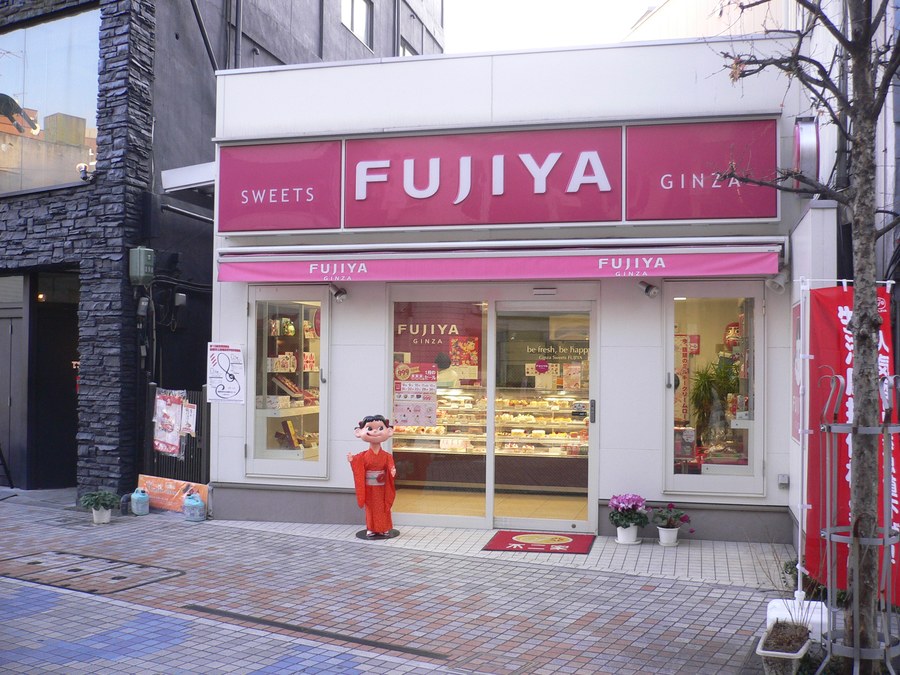
<p>Fujiya, same test, its own window in December and January: listed 2 days out of
21, against 7 expected from its base rate. Nothing unusual, though I lean on
Fujiya less than on Morinaga. Morinaga’s borrow listings are corroborated by
its margin table: on days it’s in the fee list its shorts exceed its longs, on
other days they don’t, with no overlap. Fujiya’s margin numbers show no such
pattern, so its listings may mean something slightly different, and I read them
as no sign of crowding rather than as a second hard no. House Foods never
appears in its window at all. There are entries reading “House” in those weeks,
but they sit above Ajinomoto (2802) in the code order, which makes them Daiwa
House or Sekisui House, the construction companies, codes 1925 and 1928.
House Foods is 2810 and would print after Ajinomoto. Marudai appears nowhere in
two years.<sup id="fnref:18" role="doc-noteref"><a href="#fn:18" class="footnote" rel="footnote">18</a></sup></p>

<p>For completeness, one price result did survive its checks: the food sector fell
about 1.4% against the market on the day reporting of the House extortion
resumed. So the instruments do see the public reaction to the news; what they
don’t see is anything ahead of it.</p>

<p>The convertible bonds got their own test, because they were the one instrument
in 1984 Japan you could trade with real anonymity, no margin account, no printed
short balance. You can’t practically short a convertible, so the trade available to an
insider is the reverse: crash the stock with your own crime, then quietly
accumulate the bond in the panic and ride the recovery. House’s bond, through the
exact post-disclosure trough where that accumulation would happen, traded at
the bottom of its own volume distribution, less than normal rather than more,
with a control that detects a threefold volume increase 96% of the time.<sup id="fnref:19" role="doc-noteref"><a href="#fn:19" class="footnote" rel="footnote">19</a></sup></p>

<div style="clear:both;"></div>

<h2 id="the-one-time-the-money-moved">The one time the money moved</h2>

<p>There is a version of the theory that isn’t about shorting at all, and it is
the strongest one anyone has proposed. Manabu Miyazaki, a former stock reporter
who was himself questioned in the case, argued the money was in a raid:
accumulate a big block of the target quietly, run the price up, squeeze the
shorts, and then get the company or its friendly shareholders to take the block
off your hands at a premium. He put the figure at ten billion yen.<sup id="fnref:20" role="doc-noteref"><a href="#fn:20" class="footnote" rel="footnote">20</a></sup> Every test
above is blind to that by construction, because they all look for selling
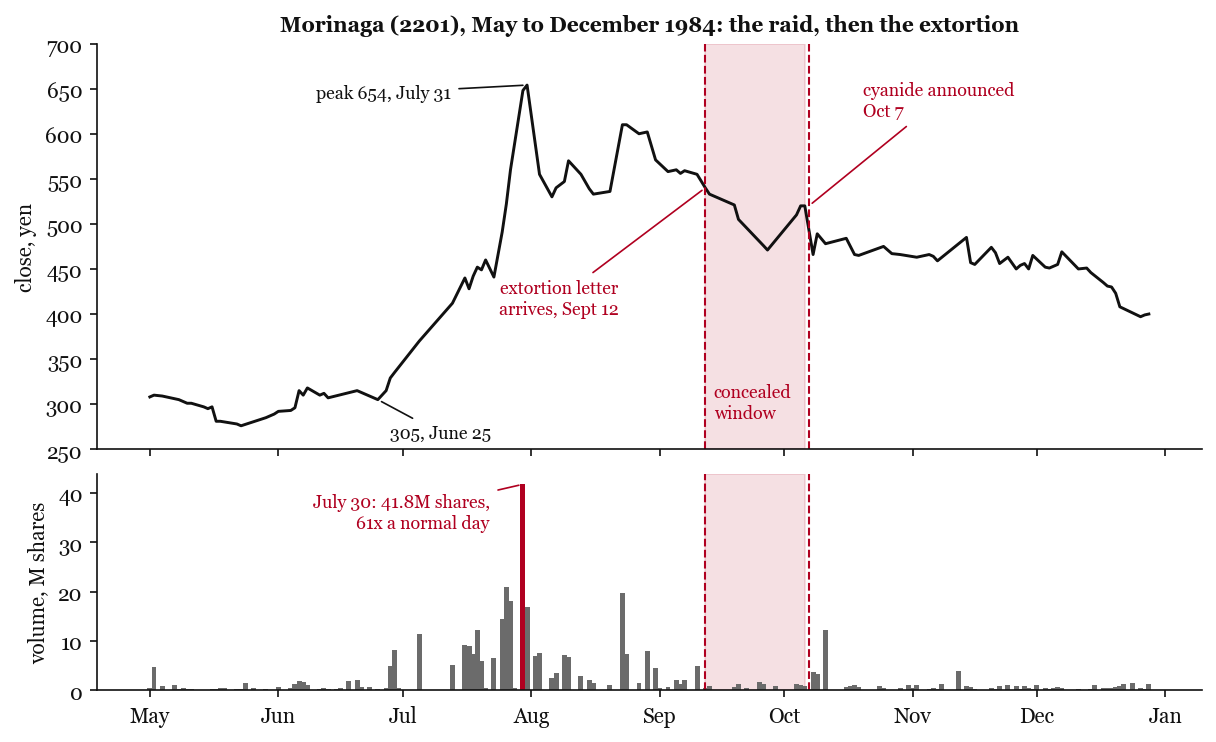
pressure. So I went back and looked for buying pressure, and found the squeeze
I mentioned when reading the margin table. In the summer of 1984 Morinaga’s
stock went from 305 yen on June 25 to 654 on July 31. On July 30 alone, 41.8
million shares traded (I checked that figure against the plate by eye, since it
was the one number big enough to be an OCR error, and it is right), sixty times
a normal day and more than a tenth of the entire company in a single session.
The borrow went into shortage and the exchange imposed its 60% collateral rule.
It has the shape of a raid, and it is the one place in two years of data where
somebody unmistakably made a great deal of money in a Glico-Morinaga
target.<sup id="fnref:21" role="doc-noteref"><a href="#fn:21" class="footnote" rel="footnote">21</a></sup></p>

<p><img src="/assets/glico/raid_chart.png" alt="Morinaga price and volume, May to December 1984" width="1216" height="742" loading="lazy" /></p>

<p>And here is the row on the July 30 price page that the big bar rests on, one
continuous strip: code 2201, the name, the morning session’s open, high, low
and close, the afternoon’s, then the day’s change (up 70) and the volume cell
reading 41780:</p>

<p><img src="/assets/glico/raid_plate_0730.png" alt="The Morinaga row of the July 30 1984 price page" width="1440" height="37" loading="lazy" /></p>

<p>How unusual is it? Taking every stock in my 1984 data with clean coverage and
measuring each one’s best five-week gain, Morinaga is first of 44, and first
again after dividing by each stock’s own volatility: 4.5 standard deviations
against a next-best 3.4. Only four of the 44 managed a 50% gain in any
five-week stretch that year, and the runners-up mostly peaked in other months,
so this isn’t the summer rally showing through. Over the identical window the
Nikkei fell 1.7% and the other food companies went nowhere: Meiji down 4%,
Glico up 2%, Fujiya down 6%. Two caveats apply. The borrow fee itself was
ordinary, 10 to 30 sen, where nearly half of all positive fees that year were
larger, so the stock was crowded but not historically so. And my data covers 44
food and machinery names out of roughly a thousand listed in Tokyo, in a year
the market rose 17%. It was the most violent move in my data; whether it was
the most violent on the exchange that year, 44 names can’t say.</p>

<p>The problem for the theory is the calendar. The raid peaked on July 31 and was
already unwinding when the extortion letter reached Morinaga on September 12:
shorts had halved, the price was down to 540. The raid was over before the
extortion began. And the people who were long on margin never got out. Their
balance sat at 24 to 28 million shares straight through the concealed window
and into the cyanide crash, from 648 to 466. The crowd that followed the raid
ended up as the extortion’s victims. Nor was any other target run up before its
own letter: a test on the thirty sessions before each threat comes back flat
for all five companies. What market data can’t exclude is a block sale to
friendly hands in August, off the exchange, followed by an extortion with some
other motive. That is a question for paper records, and they exist: the fiscal
1984 securities reports list each company’s ten largest shareholders, and a new
large holder who appeared in Morinaga or Fujiya that year and then vanished
would settle it. They’re on microfilm in an Osaka library.<sup id="fnref:22" role="doc-noteref"><a href="#fn:22" class="footnote" rel="footnote">22</a></sup> If anyone goes,
I’d like to know what they find.</p>

<p>There is one loose coincidence. Morinaga’s raid starts at the end of June, but
its borrow squeeze, the part the lending table records, begins on July 12, the
first trading session after the date usually given for a batch of threat
letters mailed to several food companies at once, letters that reportedly
stayed out of the press until October. The sourcing on those letters is thin,
Morinaga isn’t clearly among the addressees, and a date match found after the
fact proves nothing.<sup id="fnref:23" role="doc-noteref"><a href="#fn:23" class="footnote" rel="footnote">23</a></sup> But who got the July letters, and when, is the other
archive question I’d like answered.</p>

<h2 id="how-much-money-was-even-in-it">How much money was even in it?</h2>

<p>All of the above is absence of footprints, and small trades don’t leave
footprints. So the last calculation flips the question and asks how much money
there was to make. Assume perfect foresight of every event and of the date each
one became public (the criminals controlled those dates, so this is fair), zero
market impact, and 1984’s actual trading costs, which were not small: fixed
commissions plus a 0.55% securities transaction tax.<sup id="fnref:24" role="doc-noteref"><a href="#fn:24" class="footnote" rel="footnote">24</a></sup> The constraint that
remains is volume. You cannot sell short more shares than the market buys from
you.</p>

<p>One trade in the list runs the other way. On June 26, 1984 the gang sent a
letter saying it was done with Glico (“if we make children cry, that’s trouble
for us too; we forgive Ezaki Glico”), and Glico’s shares, down by a quarter
since the kidnapping, recovered on the news. Someone who knew that letter was
coming buys rather than sells, so that trade is priced as a long.</p>

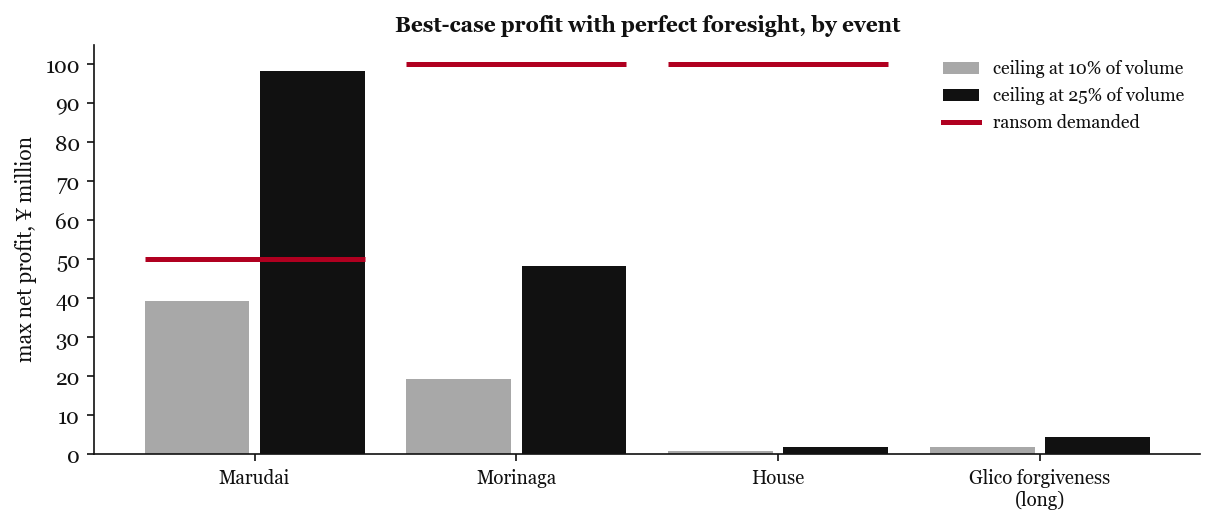
<p>Run the campaign at 10% of every session’s printed volume, every session of
every concealed window, and cover into the panic afterwards:</p>

<table>
  <thead>
    <tr>
      <th>event</th>
      <th>max net profit</th>
      <th>demanded</th>
    </tr>
  </thead>
  <tbody>
    <tr>
      <td>Marudai window</td>
      <td>¥39M</td>
      <td>¥50M</td>
    </tr>
    <tr>
      <td>Morinaga window</td>
      <td>¥19M to ¥40M</td>
      <td>¥100M</td>
    </tr>
    <tr>
      <td>House window</td>
      <td>¥0.8M</td>
      <td>¥100M</td>
    </tr>
    <tr>
      <td>Glico forgiveness letter, long</td>
      <td>¥1.8M</td>
      <td> </td>
    </tr>
    <tr>
      <td>whole campaign</td>
      <td>about ¥61M</td>
      <td>¥350M or more in cash demands</td>
    </tr>
  </tbody>
</table>

<p>(Morinaga gets a range because only 9 of the roughly 17 sessions in its window
have usable prices; doubling the printed figure is the generous reading, and
it changes nothing below.)</p>

<p><img src="/assets/glico/ceiling.png" alt="Profit ceiling vs ransoms" width="1215" height="525" loading="lazy" /></p>

<p>House Foods is the clearest case. The stock traded around 33,000 shares a day,
and the most the entire concealed window could have paid, with perfect
knowledge and aggressive execution, was about two million yen, against a
hundred-million-yen demand.</p>

<p>At 25% participation Marudai’s ceiling does clear its ransom, ¥98M against ¥50M
demanded. But 25% of every session for five months in a stock that trades
73,000 shares a day is not a hidden trade; at that size it is the market, and
the price tests, the borrow table and the margin ledger would all have shown
it. None of them do, and the margin ledger shows the opposite. Put together:
the quiet version of the trade could not have covered a single ransom, and the
version that could would have shown up in at least three of the records above.</p>

<p>And there was no way around the cash market: no stock index futures in Japan
until 1987, no listed options until 1989.<sup id="fnref:25" role="doc-noteref"><a href="#fn:25" class="footnote" rel="footnote">25</a></sup> The instruments you would use to
do this properly did not exist in 1984.</p>

<h2 id="what-i-cant-rule-out">What I can’t rule out</h2>

<figure class="float-right" style="float:right; width:30%; margin:0.2em 0 1em 1.6em;">
  <img src="/assets/glico/case/05_yaesu_ft208.jpg" alt="A Yaesu FT-208 handheld amateur radio" width="640" height="480" style="width:100%;" loading="lazy" />
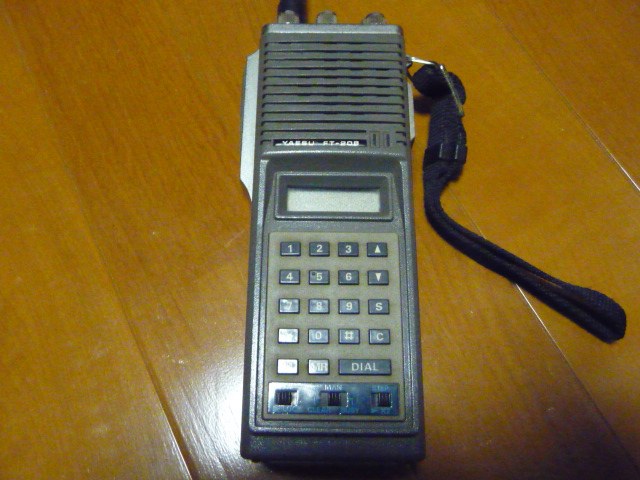
  <figcaption>A Yaesu FT-208 handheld. The group monitored police radio during the ransom drops, and a radio of this model was among the things they left behind. Photo: Suzukijimny, 2013, CC BY-SA 3.0.</figcaption>
</figure>

<p>The first gap is Osaka. This was a Kansai crime: the offenders worked out of
Kansai, the letters went to Osaka newspapers, and four of the six targets were
Osaka-area companies dual-listed on the Osaka Securities Exchange, whose 1984
daily records were never digitized.<sup id="fnref:26" role="doc-noteref"><a href="#fn:26" class="footnote" rel="footnote">26</a></sup> I checked: they exist as bound volumes
in a couple of libraries, and that’s it. Prices arbitrage between venues, so
the price tests and the ceiling arithmetic above cover Osaka fine, and the one
stock deep enough for its ceiling to reach ransom scale, Morinaga, was listed in
Tokyo only.<sup id="fnref:27" role="doc-noteref"><a href="#fn:27" class="footnote" rel="footnote">27</a></sup> But Osaka’s margin books and its own lending-fee auctions are
invisible to me. A modest short routed through an Osaka broker would not appear
in anything I’ve shown you. The ceiling arithmetic says such a trade could not
have paid ransom-scale money, but nothing here rules out that it happened.</p>

<p>The second gap is small trades. Below roughly half a percent a day of price
impact, and below the reporting thresholds, a position is invisible to every
instrument here. The only answer to that is motive: such a trade nets a few
million yen across the whole campaign, and nobody kidnaps a CEO and poisons
store shelves for eighteen months for less than the smallest ransom bag they
walked away from.</p>

<p>The third is coverage. January and February 1985 prices are missing (the
bulletin changed its print format and broke my column detection; fixable, not
yet fixed), so the Fujiya announcement and the last months of the campaign, up
to the farewell letter of August 1985, were tested through the borrow record
only. The Glico kidnapping window I never tested, because I could not pin down
its press-blackout dates well enough to define one. And all of it is OCR of
forty-year-old scans, repaired and cross-checked but still a reconstruction.</p>

<div style="clear:both;"></div>

<h2 id="verdict">Verdict</h2>

<p>Two years of the exchange’s own paperwork and five independent instruments, and
every properly specified test comes back flat. The shorts were covering during
the weeks when the theory needs them to be building. The borrow table, which
visibly registers a squeeze when speculators pile into this stock, is silent
through every window in which the criminals held private information. The
convertible bond market showed nothing at the troughs. The one violent move in
a victim stock, the July raid, was over before the criminals wrote to the
company, and the people who rode it were the ones who lost.</p>

<p>Why the Monster never took the money, I don’t know; nobody does. But the
market didn’t pay them, and it couldn’t have: played perfectly, the entire
seventeen-month campaign was worth less on the Tokyo Stock Exchange than one
ransom drop they abandoned.</p>

<h2 id="appendix-how-accurate-is-the-data">Appendix: how accurate is the data</h2>

<p>Against 33 plates I read by eye, spread over the whole of 1984 (the original
three plus thirty chosen at random: 718 rows, 4,300 price cells), 89% of the
price cells the extractor produced are right, and it produced 542 of the 718
rows, so end to end the figure is 69%. The errors are not spread evenly. Four
plates have a column-splitting failure in which most cells come out wrong; the
other 29 run between 91% and 100%. Those are numbers for the raw read, which
the tests never see. What the tests use is the repaired close, and on the same
33 plates the repair layer kept a close for 37% of the stock-days (51% on
weekdays; the one-session Saturday rows mostly fail its checks and are
dropped). Of the 237 closes it kept, 231 match the plate exactly, five are
within 2% (four of them the morning close standing in for an unreadable
afternoon cell), and one is wrong by 7%. The four broken plates contribute
almost nothing to the kept set, which is the point of the layer: on a bad plate
it leaves gaps rather than wrong numbers. Every disagreement between my reading
and the extractor on an otherwise clean plate got a second look at double
magnification; of ten such cells the extractor was wrong nine times and I was
wrong once, and that one is corrected.</p>

<p>How much noise that leaves in the daily returns can be measured directly,
because a transcription error in one price hits two consecutive returns with
opposite signs and leaves a fingerprint in the autocorrelation. Measured that
way, at most 18% of a single stock’s daily return variance is leftover noise,
about 1.1% per day, which averages down to 0.16% per day over the longest
window I test. The planted-signal test on the same window, a different method
entirely, put the detection floor at 0.14% per day. Two methods landing on the
same number is the main reason I trust the error estimate.</p>

<p>A random sample can still miss the worst plates, so I also went looking for
the plates most likely to be garbage. The pipeline’s own diagnostics (share of
cells the repair layer rejected, spread of the day’s returns across stocks,
residual against the Nikkei) rank every 1984 plate by suspicion, and I
hand-read the three worst. Of 47 closes, the pipeline kept 23: 21 exactly
right, the other 2 morning closes used where the afternoon cell was
unreadable, 1 to 3% off. It threw away 24, and 19 of those really were
garbage. No fabricated value got through; the failures are missing values. One
of those plates is July 30, the day Morinaga closed at 648 after closing at 305
five weeks earlier, the peak of the July squeeze. A repair layer that rejected
big moves as OCR error would have erased it; this one kept it, because the move
came in daily steps of 5 to 8%.</p>

<h2 id="notes">Notes</h2>

<div class="footnotes" role="doc-endnotes">
  <ol>
    <li id="fn:1" role="doc-endnote">
      <p>Japanese Wikipedia, <a href="https://ja.wikipedia.org/wiki/%E3%82%B0%E3%83%AA%E3%82%B3%E3%83%BB%E6%A3%AE%E6%B0%B8%E4%BA%8B%E4%BB%B6">Glico-Morinaga case</a>, which cites the contemporary press; English summary on <a href="https://en.wikipedia.org/wiki/Glico_Morinaga_case">Wikipedia</a>. The letter quotations are as reproduced there. Concealed-window dates in this post end on the last trading day before each public date. <a href="#fnref:1" class="reversefootnote" role="doc-backlink">&#8617;&#xfe0e;</a></p>
    </li>
    <li id="fn:2" role="doc-endnote">
      <p>Edogawa Rampo, <em>The Fiend with Twenty Faces</em> (1936), <a href="https://ja.wikipedia.org/wiki/%E6%80%AA%E4%BA%BA%E4%BA%8C%E5%8D%81%E9%9D%A2%E7%9B%B8">Wikipedia</a>. <a href="#fnref:2" class="reversefootnote" role="doc-backlink">&#8617;&#xfe0e;</a></p>
    </li>
    <li id="fn:3" role="doc-endnote">
      <p>February 13, 2000. <a href="https://www.kobe-np.co.jp/news/society/202403/0017440772.shtml">Kobe Shimbun, March 2024</a>. <a href="#fnref:3" class="reversefootnote" role="doc-backlink">&#8617;&#xfe0e;</a></p>
    </li>
    <li id="fn:4" role="doc-endnote">
      <p>From the series built in this post: 512 to 471 yen across the announcement. <a href="#fnref:4" class="reversefootnote" role="doc-backlink">&#8617;&#xfe0e;</a></p>
    </li>
    <li id="fn:5" role="doc-endnote">
      <p>Ichihashi Fumiya, <em>Yami ni kieta kaijin</em> (Shinchosha, 1996), chapter 13. Video Seller was a Suginami raid group founded in April 1982; its chairman, Takahashi Hiroshi, was found dead in his office on October 19, 1985, recorded as heart failure. The company’s dissolved registration is still in the <a href="https://info.gbiz.go.jp/hojin/ichiran?hojinBango=2080401019596">government corporate register</a>. <a href="#fnref:5" class="reversefootnote" role="doc-backlink">&#8617;&#xfe0e;</a></p>
    </li>
    <li id="fn:6" role="doc-endnote">
      <p>Miyazaki Manabu and Otani Akihiro, <em>Glico-Morinaga jiken: saijuyo sankonin M</em> (Gentosha, 2000); Shiota Takeshi, <em>Tsumi no koe</em> (Kodansha, 2016; film 2020); <a href="https://shikiho.toyokeizai.net/news/0/874864">Shikiho Online, May 2025</a>. <a href="#fnref:6" class="reversefootnote" role="doc-backlink">&#8617;&#xfe0e;</a></p>
    </li>
    <li id="fn:7" role="doc-endnote">
      <p>745 yen in January 1984 to 598 on May 17, the comparison repeated in most discussions of the theory. The series built here shows the same move. <a href="#fnref:7" class="reversefootnote" role="doc-backlink">&#8617;&#xfe0e;</a></p>
    </li>
    <li id="fn:8" role="doc-endnote">
      <p><a href="https://www.jpx.co.jp/markets/statistics-equities/daily/">JPX daily market statistics archive</a>: monthly zip files of the scanned bulletin from 1981. JPX asks that the files not be redistributed, so this post shows only small excerpts; every market figure in it is my own transcription from them. <a href="#fnref:8" class="reversefootnote" role="doc-backlink">&#8617;&#xfe0e;</a></p>
    </li>
    <li id="fn:9" role="doc-endnote">
      <p><a href="https://www.jpx.co.jp/sicc/sectors/index.html">Securities Identification Code Committee</a>. <a href="#fnref:9" class="reversefootnote" role="doc-backlink">&#8617;&#xfe0e;</a></p>
    </li>
    <li id="fn:10" role="doc-endnote">
      <p><a href="https://www.jpx.co.jp/equities/trading/domestic/tvdivq0000006blj-att/tradinghours_jp.pdf">JPX, trading hours since 1949</a>. Most Saturdays had a morning session only, until February 1989 (<a href="https://indexes.nikkei.co.jp/atoz/quiz/2016/08/q08.html">Nikkei Indexes</a>). <a href="#fnref:10" class="reversefootnote" role="doc-backlink">&#8617;&#xfe0e;</a></p>
    </li>
    <li id="fn:11" role="doc-endnote">
      <p><a href="https://www.jpx.co.jp/markets/statistics-equities/margin/index.html">JPX, per-issue margin balances</a>, the present-day form of the table. <a href="#fnref:11" class="reversefootnote" role="doc-backlink">&#8617;&#xfe0e;</a></p>
    </li>
    <li id="fn:12" role="doc-endnote">
      <p><a href="https://www.taisyaku.jp/about/backwardation/">Japan Securities Finance on the lending auction</a>; <a href="https://www.jpx.co.jp/markets/statistics-equities/margin/01.html">JPX on lending fees</a>. <a href="#fnref:12" class="reversefootnote" role="doc-backlink">&#8617;&#xfe0e;</a></p>
    </li>
    <li id="fn:13" role="doc-endnote">
      <p><a href="https://www.jpx.co.jp/markets/equities/margin-reg/index.html">JPX, margin trading restrictions</a>. <a href="#fnref:13" class="reversefootnote" role="doc-backlink">&#8617;&#xfe0e;</a></p>
    </li>
    <li id="fn:14" role="doc-endnote">
      <p>As note 1. <a href="#fnref:14" class="reversefootnote" role="doc-backlink">&#8617;&#xfe0e;</a></p>
    </li>
    <li id="fn:15" role="doc-endnote">
      <p><a href="https://github.com/tesseract-ocr/tesseract">Tesseract</a>; Li et al., <a href="https://arxiv.org/abs/2109.10282">TrOCR</a>, 2021. <a href="#fnref:15" class="reversefootnote" role="doc-backlink">&#8617;&#xfe0e;</a></p>
    </li>
    <li id="fn:16" role="doc-endnote">
      <p><a href="https://fred.stlouisfed.org/series/NIKKEI225">FRED, series NIKKEI225</a>. <a href="#fnref:16" class="reversefootnote" role="doc-backlink">&#8617;&#xfe0e;</a></p>
    </li>
    <li id="fn:17" role="doc-endnote">
      <p>The same test with December 11, 1984 inside the window and without it. <a href="#fnref:17" class="reversefootnote" role="doc-backlink">&#8617;&#xfe0e;</a></p>
    </li>
    <li id="fn:18" role="doc-endnote">
      <p>Daiwa House 1925, Sekisui House 1928, Ajinomoto 2802, House Foods 2810. <a href="#fnref:18" class="reversefootnote" role="doc-backlink">&#8617;&#xfe0e;</a></p>
    </li>
    <li id="fn:19" role="doc-endnote">
      <p>House Foods’ convertible bond, December 1984 to February 1985, against a planted threefold volume increase. <a href="#fnref:19" class="reversefootnote" role="doc-backlink">&#8617;&#xfe0e;</a></p>
    </li>
    <li id="fn:20" role="doc-endnote">
      <p>Miyazaki and Otani (2000), note 6; the figure as reported in the Wikipedia article in note 1. <a href="#fnref:20" class="reversefootnote" role="doc-backlink">&#8617;&#xfe0e;</a></p>
    </li>
    <li id="fn:21" role="doc-endnote">
      <p>No contemporaneous account of the July 1984 move survives on the open web; 1984 newspaper text is not online. <a href="#fnref:21" class="reversefootnote" role="doc-backlink">&#8617;&#xfe0e;</a></p>
    </li>
    <li id="fn:22" role="doc-endnote">
      <p>Osaka Prefectural Library, which holds the reports on microfilm and copies them by post. <a href="#fnref:22" class="reversefootnote" role="doc-backlink">&#8617;&#xfe0e;</a></p>
    </li>
    <li id="fn:23" role="doc-endnote">
      <p>The letters and their October reporting date are as given in secondary chronologies; I found no primary account of who received them. If you have one, I want to hear from you. <a href="#fnref:23" class="reversefootnote" role="doc-backlink">&#8617;&#xfe0e;</a></p>
    </li>
    <li id="fn:24" role="doc-endnote">
      <p>Securities transaction tax on share sales: 0.55% from 1981, 0.30% from 1989, abolished in 1999 (<a href="https://www.jsri.or.jp/publish/market/pdf/market_31/31_14.pdf">Japan Securities Research Institute, chapter 14</a>). Brokerage commissions were fixed until 1999. <a href="#fnref:24" class="reversefootnote" role="doc-backlink">&#8617;&#xfe0e;</a></p>
    </li>
    <li id="fn:25" role="doc-endnote">
      <p><a href="https://en.wikipedia.org/wiki/Osaka_Exchange">Osaka Exchange chronology</a>: index futures June 9, 1987; Nikkei 225 futures September 1988; Nikkei 225 options June 1989. <a href="#fnref:25" class="reversefootnote" role="doc-backlink">&#8617;&#xfe0e;</a></p>
    </li>
    <li id="fn:26" role="doc-endnote">
      <p>JPX’s archive carries no Osaka equity data for the period. If you have access to the Osaka exchange’s daily records for 1984-85, I want to hear from you. <a href="#fnref:26" class="reversefootnote" role="doc-backlink">&#8617;&#xfe0e;</a></p>
    </li>
    <li id="fn:27" role="doc-endnote">
      <p>Listing venues from the 1984 exchange annual. <a href="#fnref:27" class="reversefootnote" role="doc-backlink">&#8617;&#xfe0e;</a></p>
    </li>
  </ol>
</div>]]></content><author><name>ccc909</name></author><category term="finance" /><category term="japan" /><category term="ocr" /><category term="history" /><category term="glico-morinaga" /><summary type="html"><![CDATA[Did the Glico-Morinaga kidnappers make their money on the stock market? I digitized 1984 Tokyo Stock Exchange bulletins (prices, margin balances, stock-lending fees) and tested the theory. The short answer is no, not at any scale that would have paid for the crime.]]></summary><media:thumbnail xmlns:media="http://search.yahoo.com/mrss/" url="https://ccc909.github.io/assets/glico/social/glico-card.jpg" /><media:content medium="image" url="https://ccc909.github.io/assets/glico/social/glico-card.jpg" xmlns:media="http://search.yahoo.com/mrss/" /></entry><entry><title type="html">89% of the public GraphQL web is one file: a survey of 1,000,000 domains</title><link href="https://ccc909.github.io/2026/07/22/89-percent-of-the-public-graphql-web-is-one-file/" rel="alternate" type="text/html" title="89% of the public GraphQL web is one file: a survey of 1,000,000 domains" /><published>2026-07-22T00:00:00+00:00</published><updated>2026-08-22T00:00:00+00:00</updated><id>https://ccc909.github.io/2026/07/22/89-percent-of-the-public-graphql-web-is-one-file</id><content type="html" xml:base="https://ccc909.github.io/2026/07/22/89-percent-of-the-public-graphql-web-is-one-file/"><![CDATA[<p><em>A survey of 1,000,000 domains.</em></p>

<p>89.23% of the public GraphQL endpoints in the Tranco top million serve the same schema: one file, byte-identical across all of them. It’s Shopify’s Storefront API. Add Magento and you’re at 97.67%. Everything else on the public web, every hand-built API and every other platform put together, comes to the remaining 2.33%.</p>

<p>That one number changes how to read all the others. Most published statistics about GraphQL on the web are computed over a population that is, in practice, one vendor’s default settings. So this post is in two parts: the survey, and then what happens to each of the usual numbers when you divide by vendor instead.</p>

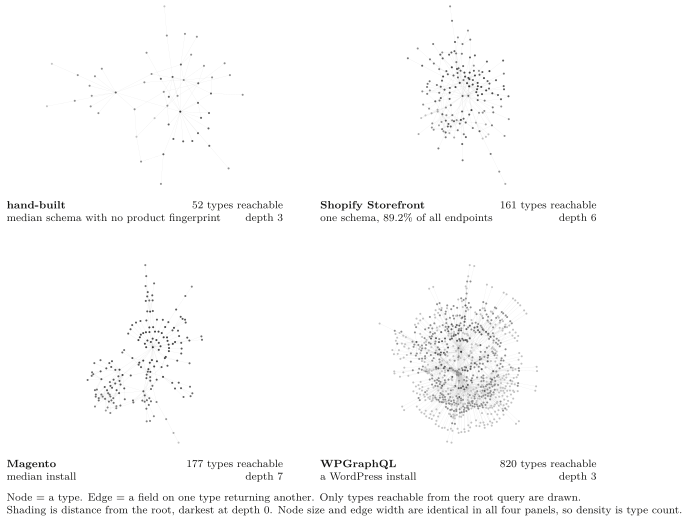
<p>It helps to have a picture of the thing being counted before the counting starts. A GraphQL schema is a directed graph: types are the nodes, and a field on one type that returns another type is an edge. Here are four of them.</p>

<p><img src="/assets/graphcensus/fig0-typegraphs.svg" alt="Four GraphQL schemas drawn as type graphs" width="689" height="522" style="width:100%;" /></p>

<p><em>Figure 1. Four schemas as type graphs. Node = a type, edge = a field returning another type, and only types reachable from the root query are drawn. Shading is distance from the root. Node size and edge width are identical across panels, so the difference in density is a difference in type count and nothing else.</em></p>

<p>Top right is the file this post is about: 161 types, six levels deep, served by 31,778 sites. Beside it is the sort of thing somebody builds when nobody hands them a schema, 52 types and three levels. Bottom right is a single WordPress install at 820 types. The largest schema in the corpus, a self-hosted GitLab with 8,254 reachable types, isn’t drawn because it wouldn’t fit on a page next to these.</p>

<h2 id="the-survey">The survey</h2>

<p>The scan covered 1,000,000 domains from the Tranco ranking and took about 120 hours. For each host it tried up to three conventional GraphQL paths and asked each one the same question: will you describe yourself?</p>

<table>
  <thead>
    <tr>
      <th> </th>
      <th style="text-align: right"> </th>
    </tr>
  </thead>
  <tbody>
    <tr>
      <td>endpoint records reached</td>
      <td style="text-align: right">645,796</td>
    </tr>
    <tr>
      <td>not GraphQL</td>
      <td style="text-align: right">518,604</td>
    </tr>
    <tr>
      <td><strong>answered but refused (403 / 401)</strong></td>
      <td style="text-align: right"><strong>66,635</strong></td>
    </tr>
    <tr>
      <td>transport error</td>
      <td style="text-align: right">22,870</td>
    </tr>
    <tr>
      <td>confirmed GraphQL</td>
      <td style="text-align: right">38,192</td>
    </tr>
    <tr>
      <td>…with a schema captured</td>
      <td style="text-align: right">35,604</td>
    </tr>
    <tr>
      <td><strong>distinct schema contents</strong></td>
      <td style="text-align: right"><strong>3,310</strong></td>
    </tr>
  </tbody>
</table>

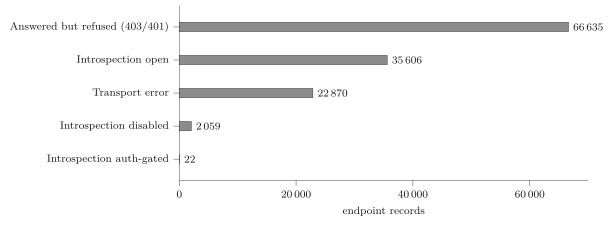
<p><img src="/assets/graphcensus/fig1-population.svg" alt="Endpoint records by classification, bar chart" width="613" height="226" loading="lazy" /></p>

<p><em>Figure 2. Endpoint records by classification. The 518,604 that were plainly not GraphQL are omitted from the plot.</em></p>

<p>The biggest bar is the one nobody reports on. 66,635 endpoints answered and refused to be classified, which is 1.75× the entire confirmed GraphQL population. Some of those are GraphQL behind a WAF and some aren’t GraphQL at all, and from the outside, without credentials, there’s no way to tell which.</p>

<p>That much is measured. What follows is inference: a 403 from an edge proxy is itself a defensive posture, so refusal plausibly correlates with being better defended. If so, every public GraphQL security statistic, this one included, describes the less defended part of the population, and the gap is not small.</p>

<h2 id="nineteen-products">Nineteen products</h2>

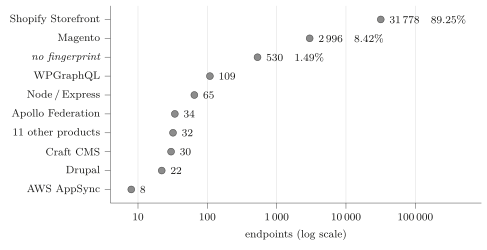
<p>98.51% of endpoints with a captured schema are running a schema that belongs to a recognisable product. That leaves 530 endpoints (1.49%) where a human wrote the schema for that particular site.</p>

<p><img src="/assets/graphcensus/fig2-products.svg" alt="Endpoints by detected product, log scale" width="487" height="250" loading="lazy" /></p>

<p><em>Figure 3. Endpoints by detected product. Log scale, because a linear one shows Shopify and nothing else.</em></p>

<table>
  <thead>
    <tr>
      <th>product</th>
      <th style="text-align: right">endpoints</th>
      <th style="text-align: right">share</th>
      <th style="text-align: right">distinct schemas</th>
    </tr>
  </thead>
  <tbody>
    <tr>
      <td>Shopify Storefront</td>
      <td style="text-align: right">31,778</td>
      <td style="text-align: right">89.25%</td>
      <td style="text-align: right">9</td>
    </tr>
    <tr>
      <td>Magento</td>
      <td style="text-align: right">2,996</td>
      <td style="text-align: right">8.42%</td>
      <td style="text-align: right">2,669</td>
    </tr>
    <tr>
      <td><em>no fingerprint</em></td>
      <td style="text-align: right">530</td>
      <td style="text-align: right">1.49%</td>
      <td style="text-align: right">391</td>
    </tr>
    <tr>
      <td>WPGraphQL</td>
      <td style="text-align: right">109</td>
      <td style="text-align: right">0.31%</td>
      <td style="text-align: right">101</td>
    </tr>
    <tr>
      <td>Node / Express</td>
      <td style="text-align: right">65</td>
      <td style="text-align: right">0.18%</td>
      <td style="text-align: right">42</td>
    </tr>
    <tr>
      <td>Apollo Federation</td>
      <td style="text-align: right">34</td>
      <td style="text-align: right">0.10%</td>
      <td style="text-align: right">21</td>
    </tr>
    <tr>
      <td>Craft CMS</td>
      <td style="text-align: right">30</td>
      <td style="text-align: right">0.08%</td>
      <td style="text-align: right">21</td>
    </tr>
    <tr>
      <td>Drupal</td>
      <td style="text-align: right">22</td>
      <td style="text-align: right">0.06%</td>
      <td style="text-align: right">21</td>
    </tr>
    <tr>
      <td>11 others</td>
      <td style="text-align: right">32</td>
      <td style="text-align: right">0.09%</td>
      <td style="text-align: right">30</td>
    </tr>
  </tbody>
</table>

<p>Magento’s row looks like diversity on paper (2,669 distinct schemas across 2,996 installs, nearly one per deployment), but it’s one product with different modules switched on. Hashing each schema by its sorted set of type names instead of its bytes, to see how much of that variety is cosmetic, only collapses 3,310 schemas to 3,026 shapes, a reduction of 8.6%. So the installs really do differ. They differ the way two WordPress sites with different plugins differ.</p>

<p>Magento is also the only product in the corpus that’s uniform enough to recognise from its content alone. If you cluster the schemas by shared field vocabulary at a 70% threshold, 81% of Magento’s land in a single cluster. Drupal’s 21 schemas fall into 19 separate clusters, and Apollo Federation’s 21 into 19. Magento generates its schema from a fixed core; the others assemble one per site, and two installs of the same product can end up with almost nothing in common.</p>

<p>None of that dents the concentration.</p>

<p><img src="/assets/graphcensus/fig3-concentration.svg" alt="Cumulative share of endpoints against distinct schemas" width="449" height="241" loading="lazy" /></p>

<p><em>Figure 4. Cumulative share of endpoints against distinct schemas, ranked by deployment count.</em></p>

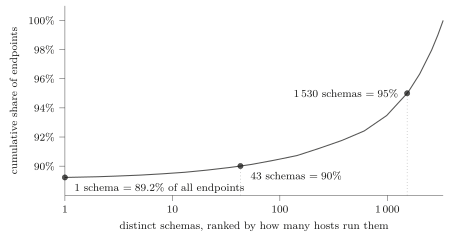
<p>43 schemas cover 90% of the public GraphQL web, or 28 if you go by type-name shape. Getting to 95% takes 1,530 schemas and getting to 99% takes 2,954, because once you’re past the shoulder of the curve the corpus is one-offs.</p>

<p>This isn’t 35,604 engineering decisions. It’s about twenty, and one of them is 89%.</p>

<h2 id="what-that-does-to-every-statistic">What that does to every statistic</h2>

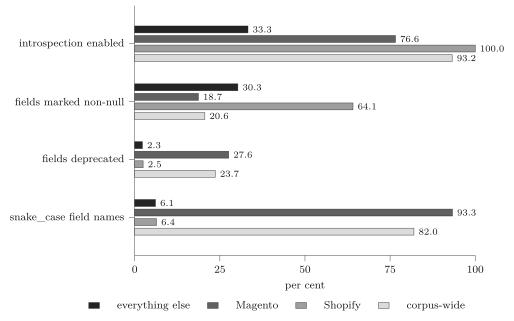
<p>Here is the same corpus, with four common statistics computed over everything and then by vendor.</p>

<p><img src="/assets/graphcensus/fig4-stratified.svg" alt="Four schema statistics, corpus-wide and by vendor" width="514" height="321" loading="lazy" /></p>

<p><em>Figure 5. Four statistics, computed corpus-wide and then by vendor.</em></p>

<table>
  <thead>
    <tr>
      <th> </th>
      <th style="text-align: right">corpus-wide</th>
      <th style="text-align: right">Shopify</th>
      <th style="text-align: right">Magento</th>
      <th style="text-align: right">everything else</th>
    </tr>
  </thead>
  <tbody>
    <tr>
      <td>introspection enabled</td>
      <td style="text-align: right">93.23%</td>
      <td style="text-align: right"><strong>100.00%</strong></td>
      <td style="text-align: right">76.57%</td>
      <td style="text-align: right"><strong>33.27%</strong></td>
    </tr>
    <tr>
      <td>fields marked non-null</td>
      <td style="text-align: right">20.6%</td>
      <td style="text-align: right"><strong>64.1%</strong></td>
      <td style="text-align: right">18.7%</td>
      <td style="text-align: right">30.3%</td>
    </tr>
    <tr>
      <td>fields deprecated</td>
      <td style="text-align: right">23.67%</td>
      <td style="text-align: right">2.48%</td>
      <td style="text-align: right"><strong>27.60%</strong></td>
      <td style="text-align: right">2.27%</td>
    </tr>
    <tr>
      <td>snake_case field names</td>
      <td style="text-align: right">82.0%</td>
      <td style="text-align: right">6.4%</td>
      <td style="text-align: right"><strong>93.3%</strong></td>
      <td style="text-align: right">6.1%</td>
    </tr>
  </tbody>
</table>

<p>“94% of GraphQL endpoints expose introspection” is probably the most-quoted number in this field. Shopify’s Storefront API is documented as publicly introspectable, so that’s a product decision, and it sets the aggregate on its own. Strip out the two platforms and introspection is enabled on 33% of what’s left, which is the figure for APIs whose operators actually chose the setting.</p>

<p>Stratifying the other three rows flips them.</p>

<ul>
  <li><strong>Deprecation.</strong> 23.67% of the corpus’s fields are marked deprecated and still queryable, which looks like a web-wide pile-up of dead surface. Nearly all of it comes from Magento’s code generator. Outside Magento, the median schema deprecates 0.05% of its fields.</li>
  <li><strong>Nullability.</strong> 79% of the corpus’s fields may return null, which would oblige every client to check every response. But Shopify, the largest single deployment, marks 64.1% of its fields non-null. There isn’t a web-wide level here, just a spread between vendors that runs from about two-thirds guaranteed down to about one-fifth.</li>
  <li><strong>Naming.</strong> The corpus is 82% snake_case, which goes against the ecosystem convention. Outside Magento it’s about 94% camelCase, in line with it.</li>
</ul>

<p>When there’s a monoculture in the denominator, an unstratified statistic is a statement about the monoculture. That’s the whole finding, really, and it applies to the measure people ask about most.</p>

<p>99.5% of endpoints have a cycle in their type graph that’s reachable from the root query and passes through a list-returning field, which is the structural precondition for query amplification. Of the schemas that have one, 0.57% declare a cost, depth or rate directive. Both numbers are real, and neither says much. The structure is close to definitional (a category contains categories, a product relates to products), and it reads 99.5% because 89% of the corpus is one file that happens to have a cycle. Stratified, it’s 100% at Shopify, 100% at Magento, and 80.6% everywhere else.</p>

<h2 id="the-dominant-schema-doesnt-move-until-it-moves-everywhere-at-once">The dominant schema doesn’t move, until it moves everywhere at once</h2>

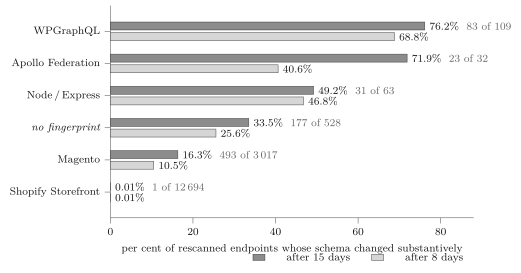
<p>Over fifteen days of rescans, 1,046 endpoints came back with a schema different from the one on record. Whether that number means anything depends on two things.</p>

<p>The first is whether they’re independent events or one vendor push fanned out across thousands of hosts. The largest single schema-to-schema transition in those fifteen days covers 16 endpoints, so within this window they’re independent. That stops being true later, and the section ends with the case where it does. The second is the denominator: on a 90-day rescan cadence only part of the corpus was revisited, so churn has to be measured against what was actually looked at.</p>

<p><img src="/assets/graphcensus/fig6-churn.svg" alt="Share of rescanned endpoints whose schema changed over fifteen days, by product" width="521" height="273" loading="lazy" /></p>

<p><em>Figure 6. Share of rescanned endpoints whose schema changed substantively over fifteen days. Description-only edits, and schemas that generate a fresh default value on every request, are excluded.</em></p>

<table>
  <thead>
    <tr>
      <th> </th>
      <th style="text-align: right">rescanned</th>
      <th style="text-align: right">changed</th>
      <th style="text-align: right">churn</th>
      <th style="text-align: right"><em>at 8 days</em></th>
    </tr>
  </thead>
  <tbody>
    <tr>
      <td>Shopify Storefront</td>
      <td style="text-align: right">12,694</td>
      <td style="text-align: right"><strong>1</strong></td>
      <td style="text-align: right"><strong>0.01%</strong></td>
      <td style="text-align: right"><em>0.01%</em></td>
    </tr>
    <tr>
      <td>Magento</td>
      <td style="text-align: right">3,017</td>
      <td style="text-align: right">493</td>
      <td style="text-align: right">16.34%</td>
      <td style="text-align: right"><em>10.50%</em></td>
    </tr>
    <tr>
      <td><em>no fingerprint</em></td>
      <td style="text-align: right">528</td>
      <td style="text-align: right">177</td>
      <td style="text-align: right">33.52%</td>
      <td style="text-align: right"><em>25.57%</em></td>
    </tr>
    <tr>
      <td>WPGraphQL</td>
      <td style="text-align: right">109</td>
      <td style="text-align: right">83</td>
      <td style="text-align: right"><strong>76.15%</strong></td>
      <td style="text-align: right"><em>68.81%</em></td>
    </tr>
    <tr>
      <td>Apollo Federation</td>
      <td style="text-align: right">32</td>
      <td style="text-align: right">23</td>
      <td style="text-align: right">71.88%</td>
      <td style="text-align: right"><em>40.63%</em></td>
    </tr>
    <tr>
      <td>Node / Express</td>
      <td style="text-align: right">63</td>
      <td style="text-align: right">31</td>
      <td style="text-align: right">49.21%</td>
      <td style="text-align: right"><em>46.77%</em></td>
    </tr>
  </tbody>
</table>

<p>That’s a seven-thousand-fold range, and the last column is what makes it credible. Between the eight-day and fifteen-day measurements, every population except Shopify roughly doubled, which is what you’d expect if churn is accumulating over time. Shopify sat at exactly one changed endpoint the whole time, over more endpoints and twice the window. The instrument moves. The monoculture does not.</p>

<p>That one changed endpoint out of 12,694 has types in its schema that the Storefront API doesn’t define, so it’s probably not Shopify at all, just misfingerprinted as it. Meanwhile a WordPress site running WPGraphQL had roughly a three-in-four chance of its public API surface moving inside two weeks.</p>

<p>So the shape of the web’s GraphQL is set by the vendors who revise it least. The 11% that churns is invisible in any aggregate, and the 89% that doesn’t is what every aggregate ends up measuring.</p>

<p>Then, a week later, it moved.</p>

<p>On 21–22 August the Storefront API changed on 1,455 endpoints in two days. Measured the naive way (endpoints changed over endpoints rescanned), Shopify’s churn went from 0.01% to 11.24% overnight, a thousandfold jump. That number is wrong in exactly the way this section has been warning about.</p>

<p>Every one of the 1,455 is the same transition: same old hash, same new hash, byte-identical diff. It’s one event, seen once per host the rescan happened to reach. Counted as events rather than endpoints, Shopify’s churn over the window is 1, which is what it was before.</p>

<p>The diff itself is small and breaking: four fields removed, among them <code class="language-plaintext highlighter-rouge">QueryRoot.shopPayInstallmentsPricing</code>, plus one enum value. These are removals, so any client that was using them breaks. And because the change ships to every store at once, the corpus’s dominant schema hash dropped from 89.2% to 85.2% in 48 hours, while a new hash appeared at 4.0% and is still climbing as the rescan reaches the rest.</p>

<p>This is what a monoculture looks like from the outside. For the twenty-two days from the first rescan to that deploy, the single largest object on the public GraphQL web didn’t change at all, and then one push changed it on every host at once. There’s no intermediate state to observe, no gradual adoption, no version skew. One file, and then a different file.</p>

<p>Two things would have inflated these numbers if I hadn’t filtered them out. Drupal produced 3,335 description edits against 39 substantive ones, so 99% of its schema movement is prose rather than structure. And five endpoints report a change on every single rescan, because they embed a freshly generated UUID as an argument’s default value and are therefore never the same twice.</p>

<p>Most change is also a one-off, which suggests the public GraphQL web is redeployed occasionally rather than developed continuously. Over the full twenty-two days, of the endpoints that moved at all, 2,201 changed once, 195 twice, and 127 three times, and most of that last group is the Shopify deploy landing on hosts that had already been rescanned once.</p>

<p>As for what actually moves when something moves: there were 122,220 substantive changes across the twenty-two days, three quarters of them Magento upgrades, and the single largest was one Magento endpoint whose schema changed in 9,400 places at once, 4,129 of them breaking. Operations that existed and now don’t include <code class="language-plaintext highlighter-rouge">Mutation.Ticketing_scanBarcode</code>, <code class="language-plaintext highlighter-rouge">Mutation.InsuranceLogin</code>, <code class="language-plaintext highlighter-rouge">Query.MemberAddress</code>, and an entire feature-flag CRUD surface. Arriving in the same window were <code class="language-plaintext highlighter-rouge">Mutation.managePayoutAccount</code>, <code class="language-plaintext highlighter-rouge">Mutation.manageJoyCredit</code>, and <code class="language-plaintext highlighter-rouge">Mutation.revalidateSubscriptionsValidatedBetween</code>.</p>

<h2 id="the-15">The 1.5%</h2>

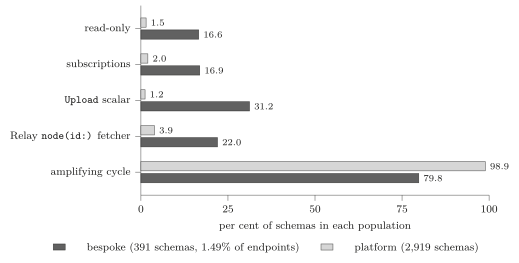
<p>Everything so far describes inherited schemas. The population I find most interesting is the 530 endpoints (391 distinct schemas) that match no fingerprint, because those are the ones where somebody actually made decisions.</p>

<p><img src="/assets/graphcensus/fig5-bespoke.svg" alt="Hand-built schemas compared with platform schemas" width="519" height="263" loading="lazy" /></p>

<p><em>Figure 7. Hand-built schemas against platform schemas.</em></p>

<table>
  <thead>
    <tr>
      <th> </th>
      <th style="text-align: right">bespoke</th>
      <th style="text-align: right">platform</th>
    </tr>
  </thead>
  <tbody>
    <tr>
      <td>median fields</td>
      <td style="text-align: right">862</td>
      <td style="text-align: right">2,656</td>
    </tr>
    <tr>
      <td>median SDL</td>
      <td style="text-align: right">57 KB</td>
      <td style="text-align: right">356 KB</td>
    </tr>
    <tr>
      <td>median mutations</td>
      <td style="text-align: right">31</td>
      <td style="text-align: right">68</td>
    </tr>
    <tr>
      <td>read-only</td>
      <td style="text-align: right">16.6%</td>
      <td style="text-align: right">1.5%</td>
    </tr>
    <tr>
      <td>subscriptions</td>
      <td style="text-align: right">16.9%</td>
      <td style="text-align: right">2.0%</td>
    </tr>
    <tr>
      <td><code class="language-plaintext highlighter-rouge">Upload</code> scalar</td>
      <td style="text-align: right"><strong>31.2%</strong></td>
      <td style="text-align: right">1.2%</td>
    </tr>
    <tr>
      <td>Relay <code class="language-plaintext highlighter-rouge">node(id:)</code> fetcher</td>
      <td style="text-align: right"><strong>22.0%</strong></td>
      <td style="text-align: right">3.9%</td>
    </tr>
  </tbody>
</table>

<p>Hand-built schemas are about six times smaller, eleven times more likely to be read-only, and eight times more likely to use subscriptions.</p>

<p>Almost all of the security-shaped surface in the corpus also lives in this 1.5%.</p>

<p><strong>File upload.</strong> The <code class="language-plaintext highlighter-rouge">Upload</code> scalar appears in 31.2% of bespoke schemas and in zero Shopify or Magento schemas. 33 of them pair it with an admin-prefixed operation.</p>

<p><strong>The Relay global object fetcher.</strong> A root <code class="language-plaintext highlighter-rouge">node</code>/<code class="language-plaintext highlighter-rouge">nodes</code> field returns any object in the graph from an opaque ID. If authorization is enforced per resolver rather than per object, this is the field that routes around it, and 22% of bespoke schemas expose one.</p>

<p><strong>Money movement.</strong> 54 schemas expose mutations with names like <code class="language-plaintext highlighter-rouge">refundOrder</code>, <code class="language-plaintext highlighter-rouge">withdrawMoney</code>, <code class="language-plaintext highlighter-rouge">transferamounttobankaccount</code> and <code class="language-plaintext highlighter-rouge">capturePayPalPayment</code>. That’s 9.7% of bespoke schemas, 0.3% of Magento, and zero at Shopify. The platforms keep money operations off the public schema, and people rolling their own tend to put them on it.</p>

<p><strong>Federation internals.</strong> 15 schemas expose <code class="language-plaintext highlighter-rouge">_entities</code> or <code class="language-plaintext highlighter-rouge">_service</code> on the root query. That’s subgraph machinery, there so a gateway can resolve references, and it belongs behind the gateway. 14 of the 15 are non-platform. It’s the one finding in the corpus that is an unambiguous misconfiguration rather than a vendor default.</p>

<p><strong>GraphiQL.</strong> 286 endpoints serve a live interactive IDE. By product that’s Node/Express at 29.6%, PostGraphile at 50%, and Strapi at 33%, against Magento at 0.23% and Shopify at zero.</p>

<p>None of that tells you whether any of it is reachable; a mutation in a schema means the surface exists, not that you can call it, and introspection only ever publishes the map, never the locks.</p>

<p>One correction to that population: 56 of the 391 bespoke schemas share the root type name <code class="language-plaintext highlighter-rouge">Domain</code> and a vocabulary of <code class="language-plaintext highlighter-rouge">_type</code>, <code class="language-plaintext highlighter-rouge">fileName</code>, <code class="language-plaintext highlighter-rouge">mainLocation</code> and <code class="language-plaintext highlighter-rouge">isHistory</code>. That’s a single digital-asset-management product with no fingerprint yet, so it’s 56 installs of one thing rather than 56 hand-built APIs, and the real monoculture is slightly worse than measured.</p>

<h2 id="what-is-actually-in-there">What is actually in there</h2>

<p>Schema size mostly tells you how much code generated the schema, and not much about what the API does. The median public schema is 340 KB. The largest is 3.3 MB, a self-hosted GitLab. The most types in one schema is 9,337, which is a different document: a hand-built Node service. If you divide SDL bytes by callable operations you get a rough measure of how much type machinery a client downloads per thing it can actually do: 10,832 bytes for Drupal, 8,919 for Shopify, 8,617 for WPGraphQL, and 555 for that Node service, a twentyfold spread.</p>

<p>The generator’s fingerprints show up in the type names. The longest in the corpus is 129 characters, from a genetics database:</p>

<div class="language-plaintext highlighter-rouge"><div class="highlight"><pre class="highlight"><code>AlleleSplitSystemCombinationsBySplitSystemCombinationComponentAlleleAlleleIdAndSplitSystemCombinationIdManyToManyConnection
</code></pre></div></div>

<p>This one is shorter, and worse:</p>

<div class="language-plaintext highlighter-rouge"><div class="highlight"><pre class="highlight"><code>AboutLiveEventsWidgetImagesdesktop_background_180x163_1440
</code></pre></div></div>

<p>That’s pixel dimensions and a CSS breakpoint inside a GraphQL type name, on the public internet, which means a redesign is also an API change.</p>

<p>You can often fingerprint a backend’s implementation language from a scalar name alone, without sending a single extra request. Shopify’s public schemas emit <code class="language-plaintext highlighter-rouge">NaiveDate</code>, <code class="language-plaintext highlighter-rouge">NaiveDateTime</code> and <code class="language-plaintext highlighter-rouge">NaiveTime</code>, which are chrono (Rust) and Elixir type names leaking through a serializer that had no opinion about them. I found nine backends identifiable this way from SDL alone: <code class="language-plaintext highlighter-rouge">@cypher</code> and <code class="language-plaintext highlighter-rouge">@relation</code> mean Neo4j, <code class="language-plaintext highlighter-rouge">ObjectId</code> means MongoDB, <code class="language-plaintext highlighter-rouge">JwtToken</code> means PostGraphile, <code class="language-plaintext highlighter-rouge">GraphQLStringOrFloat</code> means Directus, and lowercase <code class="language-plaintext highlighter-rouge">bigint</code>/<code class="language-plaintext highlighter-rouge">float8</code>/<code class="language-plaintext highlighter-rouge">daterange</code> next to <code class="language-plaintext highlighter-rouge">@cached</code> means Hasura. One isn’t even a type: a description reading “Soft-deletes a Contact (paranoia deleted_at)” names the Ruby <code class="language-plaintext highlighter-rouge">paranoia</code> gem, so that one’s Rails.</p>

<p>Scalars are where people confess. The corpus has a scalar named <code class="language-plaintext highlighter-rouge">DangerouslyNonSpecificScalar</code>, one named <code class="language-plaintext highlighter-rouge">TODO</code>, and the pair <code class="language-plaintext highlighter-rouge">UnTypedObject</code> and <code class="language-plaintext highlighter-rouge">UnTypedObject2</code>, where the <code class="language-plaintext highlighter-rouge">2</code> tells you the first escape hatch wasn’t enough. There’s <code class="language-plaintext highlighter-rouge">BooleanOrString</code>, <code class="language-plaintext highlighter-rouge">IntFalse</code>, and one just called <code class="language-plaintext highlighter-rouge">Odd</code>. And there are three tiers of HTML cleaning, <code class="language-plaintext highlighter-rouge">SanitizedHtml</code>, <code class="language-plaintext highlighter-rouge">SecureSanitizedHtml</code> and <code class="language-plaintext highlighter-rouge">StrippedHtml</code>, which makes you wonder what the first one was for.</p>

<p>If you filter the corpus down to text that appears in three or fewer distinct schemas, what’s left is roughly what a human typed. The dominant genre is the zombie field: still queryable, hardcoded to lie.</p>

<blockquote>
  <p><code class="language-plaintext highlighter-rouge">This doesn't do anything anymore, but is kept to avoid breaking existing queries</code></p>

  <p><code class="language-plaintext highlighter-rouge">always return nil (not in use, and it requires heavy db queries)</code></p>

  <p><code class="language-plaintext highlighter-rouge">AMP removed in SM-2567; always false.</code></p>
</blockquote>

<p>The second is my favourite, a field that does nothing, <em>expensively</em>. The third shipped an internal ticket number to the internet.</p>

<p>Deprecation reasons are where developers are most honest, since they’re explaining a mistake: <code class="language-plaintext highlighter-rouge">Is it required???</code>, <code class="language-plaintext highlighter-rouge">Not a real field</code>, <code class="language-plaintext highlighter-rouge">should not be there</code>, <code class="language-plaintext highlighter-rouge">This is an outdated deprecation warning</code>. One field named <code class="language-plaintext highlighter-rouge">deprecated</code> is deprecated with the reason “Fields are not being deprecated”. Elsewhere <code class="language-plaintext highlighter-rouge">crux_round_trip_time</code> is deprecated with <code class="language-plaintext highlighter-rouge">"Invalid Name. Please use cruxRoundTripTIme"</code>, a notice that complains about an invalid name and then points at a name that is also wrong. Both spellings are now load-bearing.</p>

<p>A recurring shape is the hostage situation, where a field can’t die because of something outside the team’s control: <code class="language-plaintext highlighter-rouge">retained only for SmartTV</code>, <code class="language-plaintext highlighter-rouge">Do not use. Kept for backwards compatibility (iOS legacy app)</code>, and <code class="language-plaintext highlighter-rouge">keeping this field around until we can update the the contractor app</code>, typo intact. (The contractor app, you sense, is worse than the legacy iOS app in every respect.) The champion is German and still live in 2026:</p>

<blockquote>
  <p><code class="language-plaintext highlighter-rouge">Nicht mehr Benutzen! Die Linkliste wird mit dem Relaunch 2020 gelöscht.</code></p>

  <p><em>“Do not use! The link list will be deleted with the 2020 relaunch.”</em></p>
</blockquote>

<p>That’s six years past its own execution date. Its opposite number elsewhere in the corpus is a field deprecated with <code class="language-plaintext highlighter-rouge">termination planned for 2028-03</code>, which schedules the removal two years out.</p>

<p>And one field’s entire public description is:</p>

<blockquote>
  <p><code class="language-plaintext highlighter-rouge">derrived from console.log('rateLimit', rateLimit.rateLimitDirectiveTypeDefs);</code></p>
</blockquote>

<p>That isn’t a comment about debugging. It’s the <code class="language-plaintext highlighter-rouge">console.log</code> line itself, typo and all, serving as public API documentation. Someone was debugging their rate-limit directive setup and this is the only trace of it that reached production, in a corpus where 99% of schemas declare no rate limit at all.</p>

<p>A few more that I collected along the way. There’s a mutation called <code class="language-plaintext highlighter-rouge">absorbUser</code>, which is the best verb in the corpus. There’s <code class="language-plaintext highlighter-rouge">UNSAFE__dangerouslyDeleteAsset</code>, which warns you twice in one identifier, and <code class="language-plaintext highlighter-rouge">_noop</code>, a field that does nothing and was shipped on purpose. One API documents its own error condition with a hedge and a typo: <code class="language-plaintext highlighter-rouge">Probably because the card was decliend</code>. And the long tail of the web is stranger than the front page. I found a whitewater rafting API with oddly contemplative documentation about rapids, a metallurgy API with <code class="language-plaintext highlighter-rouge">AlloyTemperItem</code>, loot-box probability as a first-class concept (<code class="language-plaintext highlighter-rouge">createLootboxItemProbabilityGroup</code>, <code class="language-plaintext highlighter-rouge">buyAndOpenLootbox</code>), a devotional app (<code class="language-plaintext highlighter-rouge">generatePrayerAudio</code>, <code class="language-plaintext highlighter-rouge">lentPrayer</code>), <code class="language-plaintext highlighter-rouge">maskLicensePlates</code>, <code class="language-plaintext highlighter-rouge">AirportGhostReplay</code>, and a March-Madness-style bracket named <code class="language-plaintext highlighter-rouge">activeKinkMadnessEvent</code>, complete with <code class="language-plaintext highlighter-rouge">adminAdvanceKinkMadnessDay</code>.</p>

<p>86.6% of field names in the corpus appear in exactly one schema (361,967 of 417,823), and the top 100 names cover only 9.8% of all field definitions. So there’s a small shared core of <code class="language-plaintext highlighter-rouge">id</code>, <code class="language-plaintext highlighter-rouge">name</code>, <code class="language-plaintext highlighter-rouge">description</code> and <code class="language-plaintext highlighter-rouge">title</code> sitting on top of a vast private vocabulary. 155 schemas are more than half deprecated. 46 have over 500 fields and not a single description among them.</p>

<h2 id="scope">Scope</h2>

<p>A reachable amplifying cycle is only a precondition; it isn’t a vulnerability in itself. A declared directive isn’t an enforced control, and the absence of one isn’t the absence of a control either, since a server can limit depth in resolver code where no schema will show it. An operation in a schema says nothing about whether it can be invoked. I tested none of this: I didn’t authenticate to any endpoint, call any mutation, or probe any vulnerability.</p>

<p>Type graphs come from the reference GraphQL parser, and I reproduced every structural result with a second, independent implementation before quoting it. The scan tried three candidate paths per host and did no subdomain enumeration. That was a deliberate trade: it gives up coverage to get a defined denominator, and you can’t report a rate without a population. Tranco is a popularity ranking, so all of this generalises to popular domains rather than to the web. And because the survey scans in rank order, rank and scan time are the same variable, which means no result stratified by popularity is interpretable until a later pass shuffles the frontier.</p>

<p>All of these numbers are a snapshot. The scanner runs on a 90-day rescan cadence, and the live database had already moved past them by the time I finished writing.</p>

<h2 id="how-it-was-collected">How it was collected</h2>

<p>The scan was read-only throughout. It fetched and honoured <code class="language-plaintext highlighter-rouge">robots.txt</code> before any probe, including <code class="language-plaintext highlighter-rouge">Crawl-delay</code>. It rate-limited itself to 2 requests per second per destination netblock, and separately capped itself at 60 newly-contacted netblocks per minute, which bounds how fast it reaches new parties rather than just how hard it hits known ones. Each host got roughly four requests, once, with no return visit for 90 days.</p>

<p>The scanner identifies itself in its User-Agent with an opt-out URL, its address resolves to forward-confirmed reverse DNS, and that URL, <a href="https://graphcensus.org/scanner">graphcensus.org/scanner</a>, serves a page explaining what the traffic is and how to stop it. The survey’s own page is <a href="https://graphcensus.org/">graphcensus.org</a>.</p>]]></content><author><name>ccc909</name></author><category term="graphql" /><category term="security" /><category term="internet-measurement" /><category term="shopify" /><category term="magento" /><summary type="html"><![CDATA[Scanned the top million domains for GraphQL. 89% of what answered is the same file. Most of the numbers people quote about GraphQL are really numbers about Shopify.]]></summary><media:thumbnail xmlns:media="http://search.yahoo.com/mrss/" url="https://ccc909.github.io/assets/graphcensus/card.png" /><media:content medium="image" url="https://ccc909.github.io/assets/graphcensus/card.png" xmlns:media="http://search.yahoo.com/mrss/" /></entry></feed>