The Monster Never Sold Short?
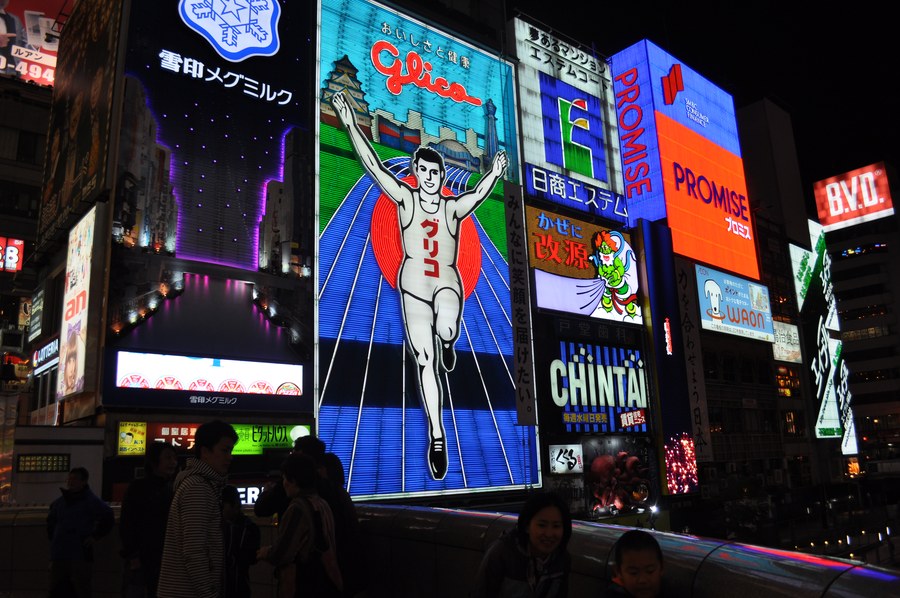
In March 1984, masked men broke into the home of the president of Ezaki Glico, the candy company, and took him out of his bath at gunpoint. He escaped after three days.1 Then Glico warehouses started burning, and letters started arriving at newspapers, signed かい人21面相, “the Monster with 21 Faces,” a villain borrowed from prewar detective novels.2 Over the next year and a half the group extorted most of the Japanese confectionery industry. They put cyanide-laced candy on store shelves, some of it with a note on the package reading “danger: poison inside, you’ll die if you eat this.” They taunted the police by name; “a fool stays a fool however hard he tries,” one letter to the newspapers said of the investigators. They demanded ¥50 million here, ¥100 million there, at one point ¥1 billion plus 100 kilograms of gold.
They never collected any of it. Every ransom drop failed or was abandoned. In August 1985 they mailed a farewell letter, “we’re done bullying food companies,” and disappeared. Nobody was ever charged. The statute of limitations ran out in 2000.3
A crime this elaborate with no visible payout needs an explanation, and there’s a popular one: the ransoms were theater, and the real money was made on the stock exchange. Sell the victims’ shares short, poison the candy, collect. The police took this seriously enough at the time to investigate speculator groups. Victim stocks really did fall. Morinaga dropped about 8% when the poisonings went public and kept sliding.4 It’s a tidy theory, it has been repeated for forty years, and as far as I can tell nobody has checked it against market data. The police came closest. In 1984 they canvassed the victim companies, the brokers and the exchange itself, ran into broker confidentiality, and named one suspect, a Tokyo speculator group called Video Seller, which Kabutocho had nicknamed “the stock market’s Monster with 21 Faces.” Its chairman turned up dead two months after the case ended, and there were no charges and no decisive evidence.5 Since then the theory has lived in investigative books (Fumiya Ichihashi’s, and a more sophisticated version from the writer Manabu Miyazaki, who was himself a suspect), in a 2016 novel and its film, and in a 2025 business-magazine chart of how Glico’s and Morinaga’s share prices moved. None of them tested it.6 The ones that cite a number all cite the same one, a 24% drop in Glico’s stock between January and May 1984, which happened in full public view and proves nothing about foreknowledge.7
There’s a reason it’s checkable at all, and it’s a detail of how Japanese media handled the case. Several of the extortions were kept out of the press entirely while negotiations ran. Marudai Foods was threatened in June 1984 and the public learned about it in November. House Foods was threatened in November, reported in December. Fujiya in December, reported the following January. During those blackout windows the threat was known to the company, the police, a few editors, and the criminals. If somebody shorted Marudai in July 1984, they either got very lucky or they were standing very close to the crime.
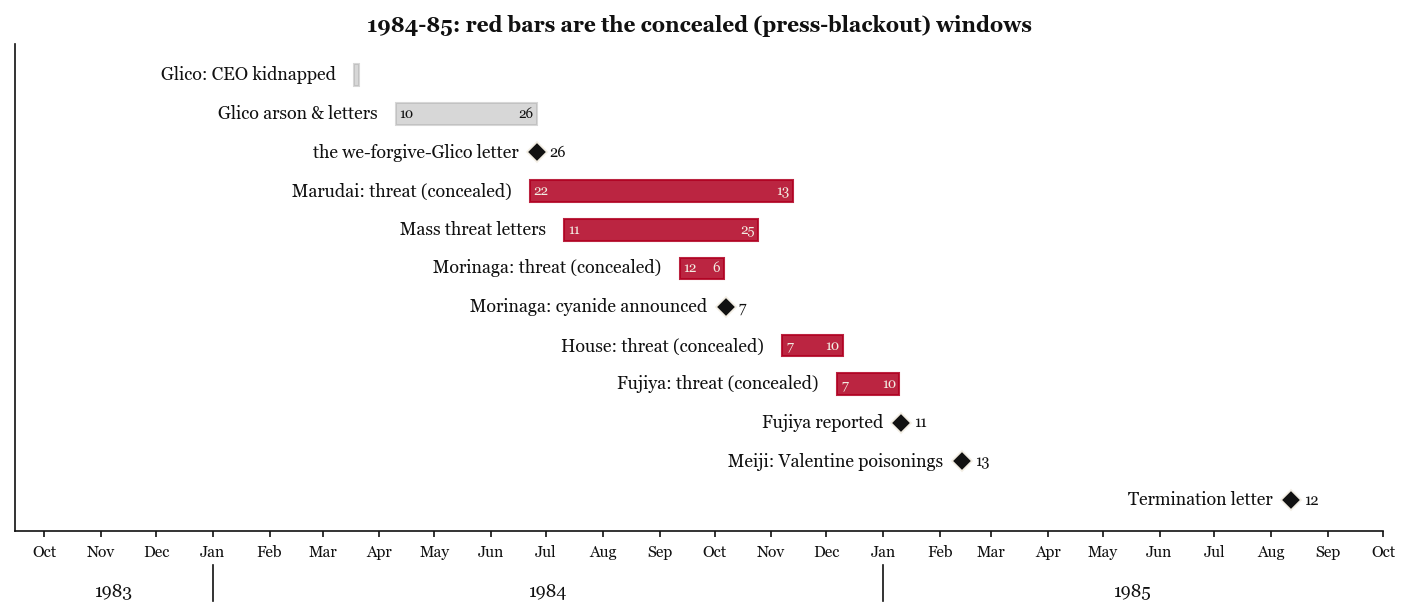
The short answer is that nothing moved in any of those windows. The rest of this post is how I know that, and then the one thing in two years of data that did move, which turned out to have nothing to do with the crime.
The data problem
There is no clean dataset of daily Japanese stock prices from 1984, no API, no vendor file worth having. What exists is the Tokyo Stock Exchange’s own daily bulletin (東京証券取引所日報), which JPX has scanned and put online as monthly zip files of TIFFs.8 One multi-page scan per trading day, roughly 4700x6500 pixels per page, black and white, photographed from what are clearly the exchange’s bound file copies. Some pages have handwritten corrections in the margins from whoever kept the files in 1984. I’ll call each scanned page a plate. That is what it is, a photograph of one printed sheet, and the rest of this post is about getting numbers off them.
I pulled the 24 months covering 1984 and 1985: 572 trading days, about 2.5 GB of TIFFs. Each day is 16 pages. Pages 1-8 are the price tables for every listed stock. Pages 12-15 are the convertible bond market. And page 16 is where the exchange printed its surveillance of its own market: per-stock margin balances, the list of stocks under restriction, and a small table of stock-lending fees.
You don’t need Japanese to follow what comes next, but you do need five pieces of market plumbing, because the whole argument runs through them.
A short primer on the 1984 Tokyo market
Securities codes. Every listed company has a four-digit number, grouped by industry. Foods are the 2000s: Morinaga is 2201, Fujiya 2211, Marudai 2288, House 2810, Glico 2206.9 The bulletin sorts by code everywhere, which matters more than it sounds, because position in a sorted list identifies a company even when its name is an unreadable smudge.
Two sessions a day. The exchange closed for lunch. Every stock got a morning session and an afternoon session, each with its own open, high, low and close, and the bulletin prints all eight numbers.10 It matters here because someone acting on information received overnight has to queue an order for the morning open, so that is where informed trading would show up.
Margin trading. Investors could buy, or sell short, on credit through a broker. A margin short sells borrowed shares. For any stock it was keeping an eye on, the exchange published the outstanding balances: shares currently sold short (the short balance) and shares held long on credit (the long balance), in thousands of shares, updated daily.11
Stock lending, and the fee. A short seller’s borrowed shares come from a securities finance company, which sources them mostly out of the margin longs. Only stocks on an approved list could be borrowed this way; the bulletin marks them with a dot next to the name. When the shorts in a stock borrowed more than the finance company could supply, there was a borrow shortage, and an auction was held to find the rest. Most days the shortage cleared at zero. When it didn’t, the shorts paid a fee per share per day, quoted in sen, 100 sen to the yen, which traders call “reverse daily interest.”12 A positive fee means the short side of that stock was crowded past what the market could lend.
The watch list and emergency rules. The exchange published which stocks it had under surveillance for speculative trading, and when things got out of hand it raised the collateral required to trade them on margin. Both sit on the same page as the lending fees.13
Five things you can measure, and what a crime would look like in each
If somebody shorted a victim company knowing an extortion was coming, here is what each instrument the bulletin supports would show:
- Prices. The target underperforms its sector during the concealed window as the selling leaks into the price. Daily closes, adjusted against the other food stocks.
- Sessions. That underperformance loads on the morning session, because overnight information gets acted on at the open.
- Volume. Unusual turnover while the position is built.
- Margin balances. The target’s short balance climbs through the window. This is the most direct record there is: a count of shares sold short.
- The borrow. The target appears in the borrow-shortage list, and if the position is big enough, starts paying a fee. The list is binary, a stock is on it that day or it isn’t, which makes it the cleanest of the five.
A sixth, the convertible bond market, gets its own test later, because it allowed a trade the other five cannot see.
Before trusting any of them I planted fake signals in the real data (a synthetic daily drag on one stock, a volume spike, a run of borrow-shortage days) and checked that each instrument found its fake. Where an instrument failed to find its fake, the corresponding result below is marked as inconclusive.
Reading the pages
The price pages first. This is the foods section on June 20, 1984, two days before the Marudai letter, with four of the five companies in the case boxed (House Foods, 2810, sits further down the section):
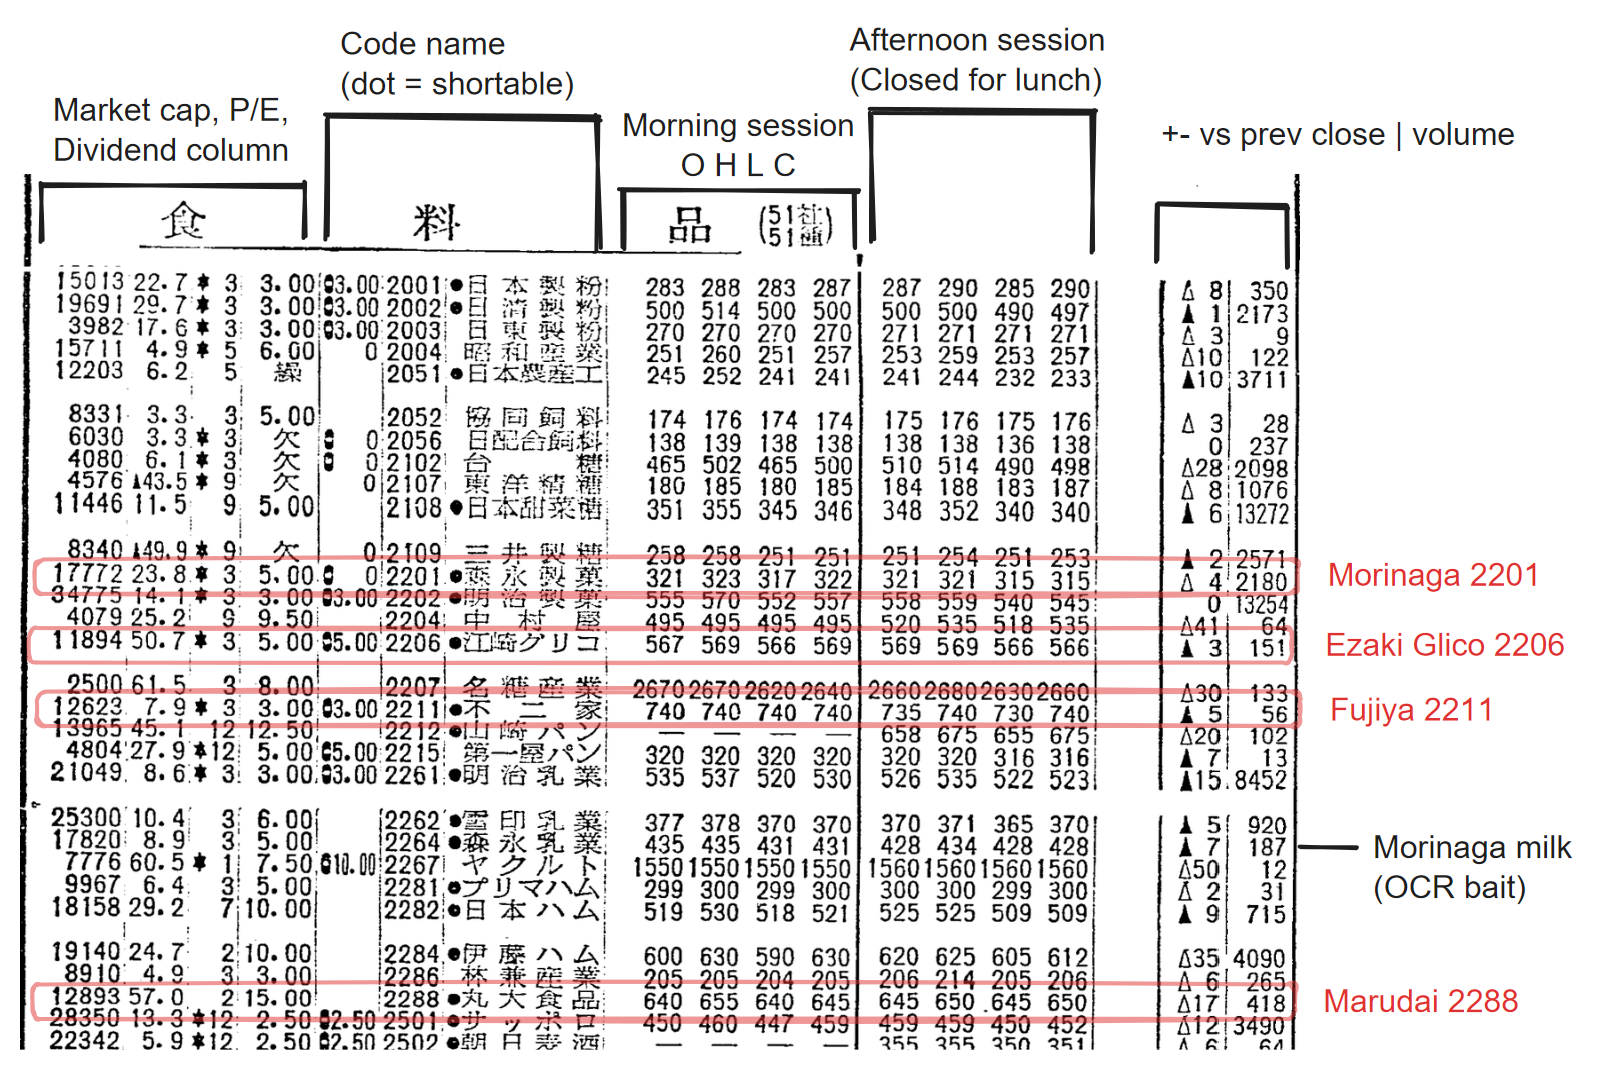
One stock per row. Size and valuation columns on the left (capital, P/E, dividend), then the code, then the name with a dot if the stock is loanable and therefore shortable, then the eight prices, morning and afternoon, then the change against the previous close with a triangle for direction, then volume. Every extortion target has the dot. One trap, labeled in black: Morinaga Milk (2264) is a different listed company from Morinaga the candy maker (2201), four rows apart, and both OCR and I confused the two at first.
Page 16 next, where the exchange watches its own market. The margin table:
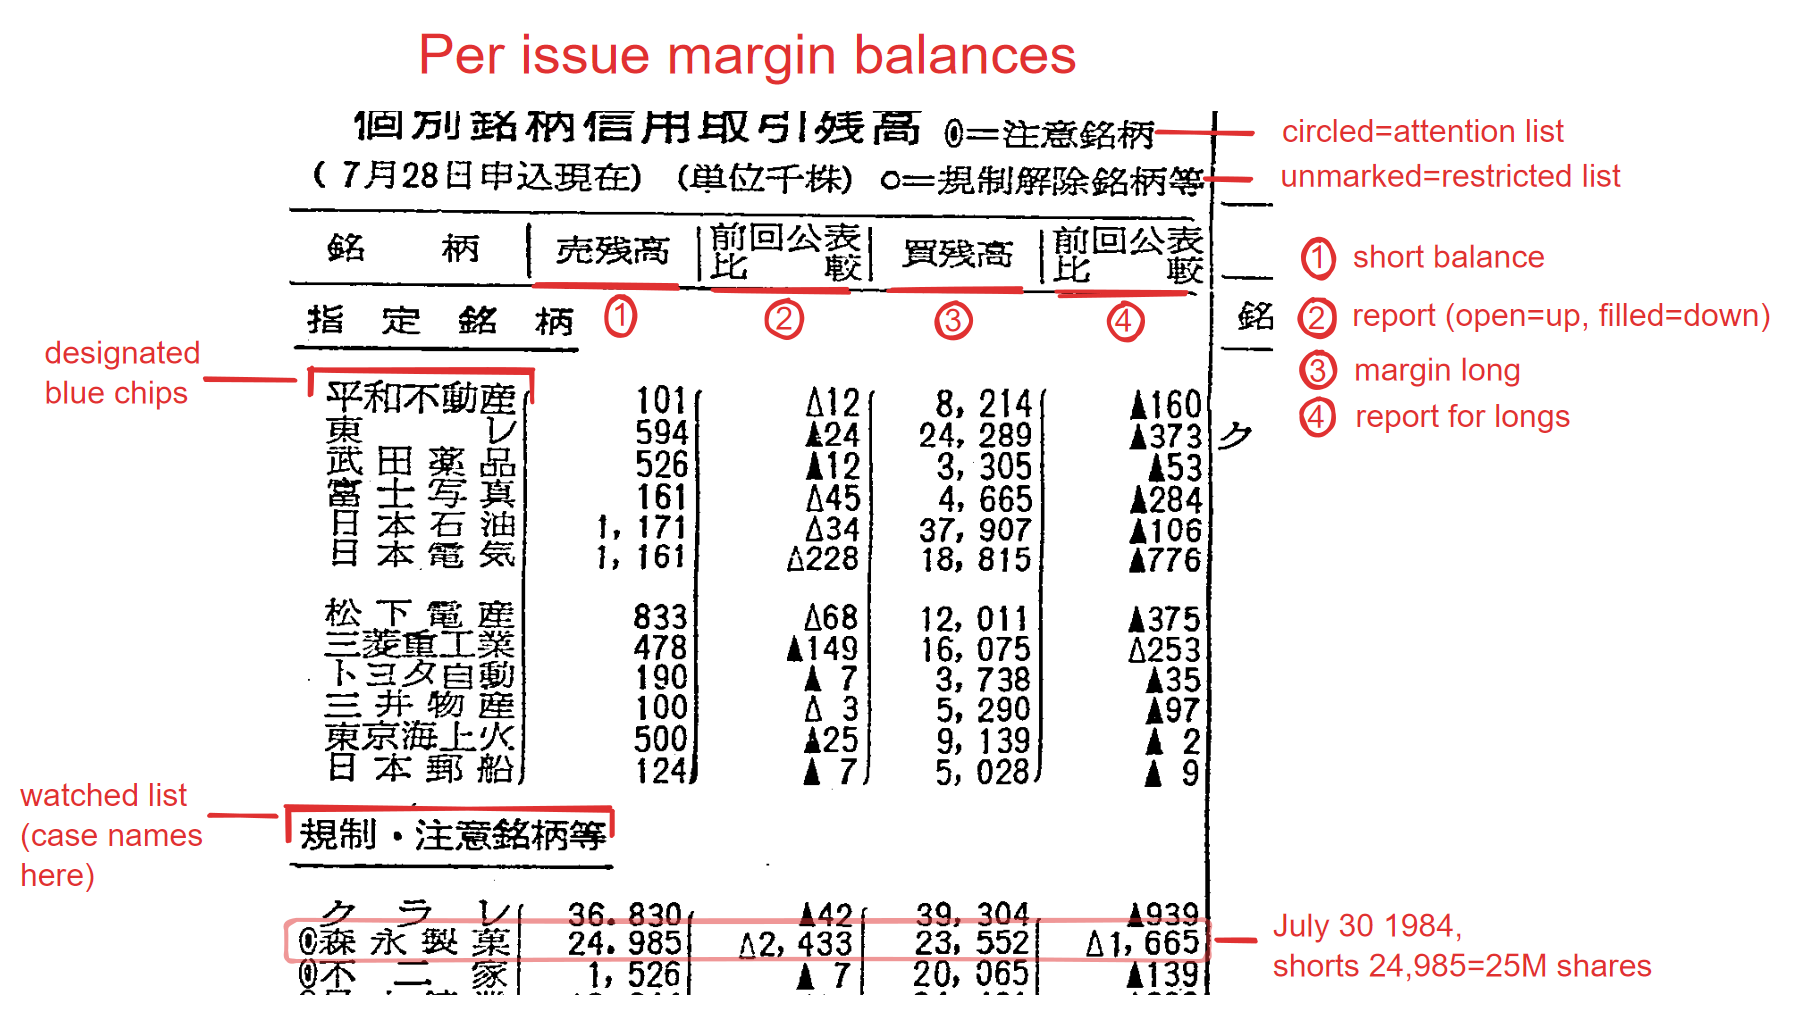
For each stock under surveillance: the short balance, the change since the last report, the long balance, and its change, all in thousands of shares. The triangles give direction, open for up and filled for down. The day shown is July 30, 1984, and Morinaga’s short balance is up 2.4 million shares in a single report. That is the tail end of a squeeze in Morinaga’s stock that summer. It has no connection to the extortion letter, which was still six weeks away; it gets its own section further down.
Now the lending-fee table:
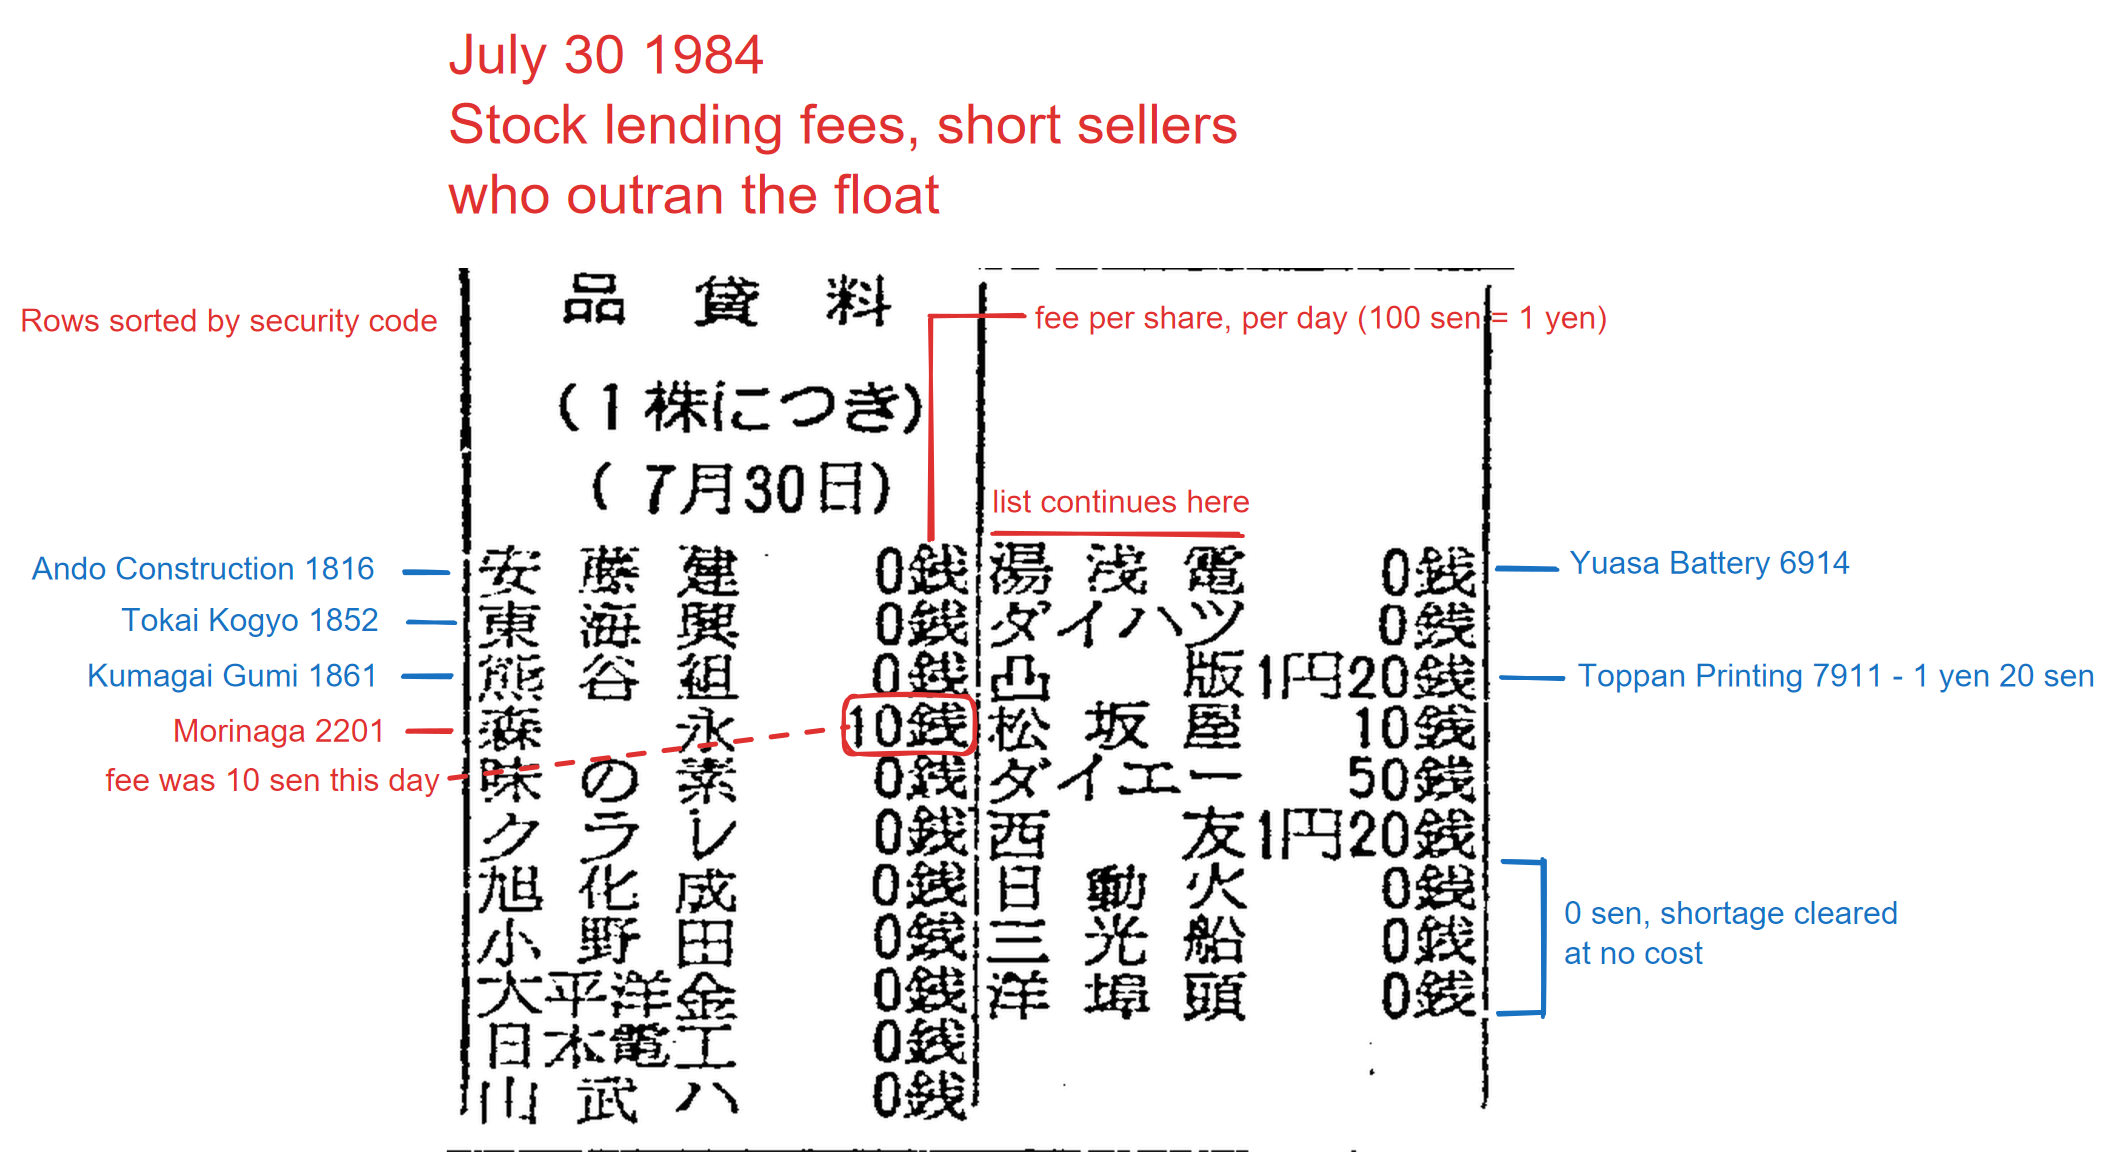
The names run left to right across a fixed-width field, so a two-character name has a gap in the middle, and the rows are sorted by code. Codes aren’t printed, but position identifies names: the construction companies in the 1800s come first, then Morinaga (2201), and Fujiya (2211) can only ever sit one or two rows below it. I used that structure to check every name match.
A stock appears here at all only when its short sellers borrowed more than the finance company could supply that day: it is the day’s list of stocks where the short side outran the lendable float. 0 sen means the shortage cleared free. A positive fee, like Morinaga’s 10 sen here, means the shorts were crowded enough that lenders charged for the privilege. The right-hand column of the same day shows the range: Toppan and Seiyu at 1 yen 20 sen, Daiei at 50 sen. Morinaga’s 10 sen sits at the low end of it.
This table matters more than the prices. Price-based tests have a noise floor: a modest trade hides inside ordinary volatility and you can never prove it isn’t there. A borrow shortage either happened on a given day or it didn’t, and the exchange printed which, every day, for two years.
One more table:
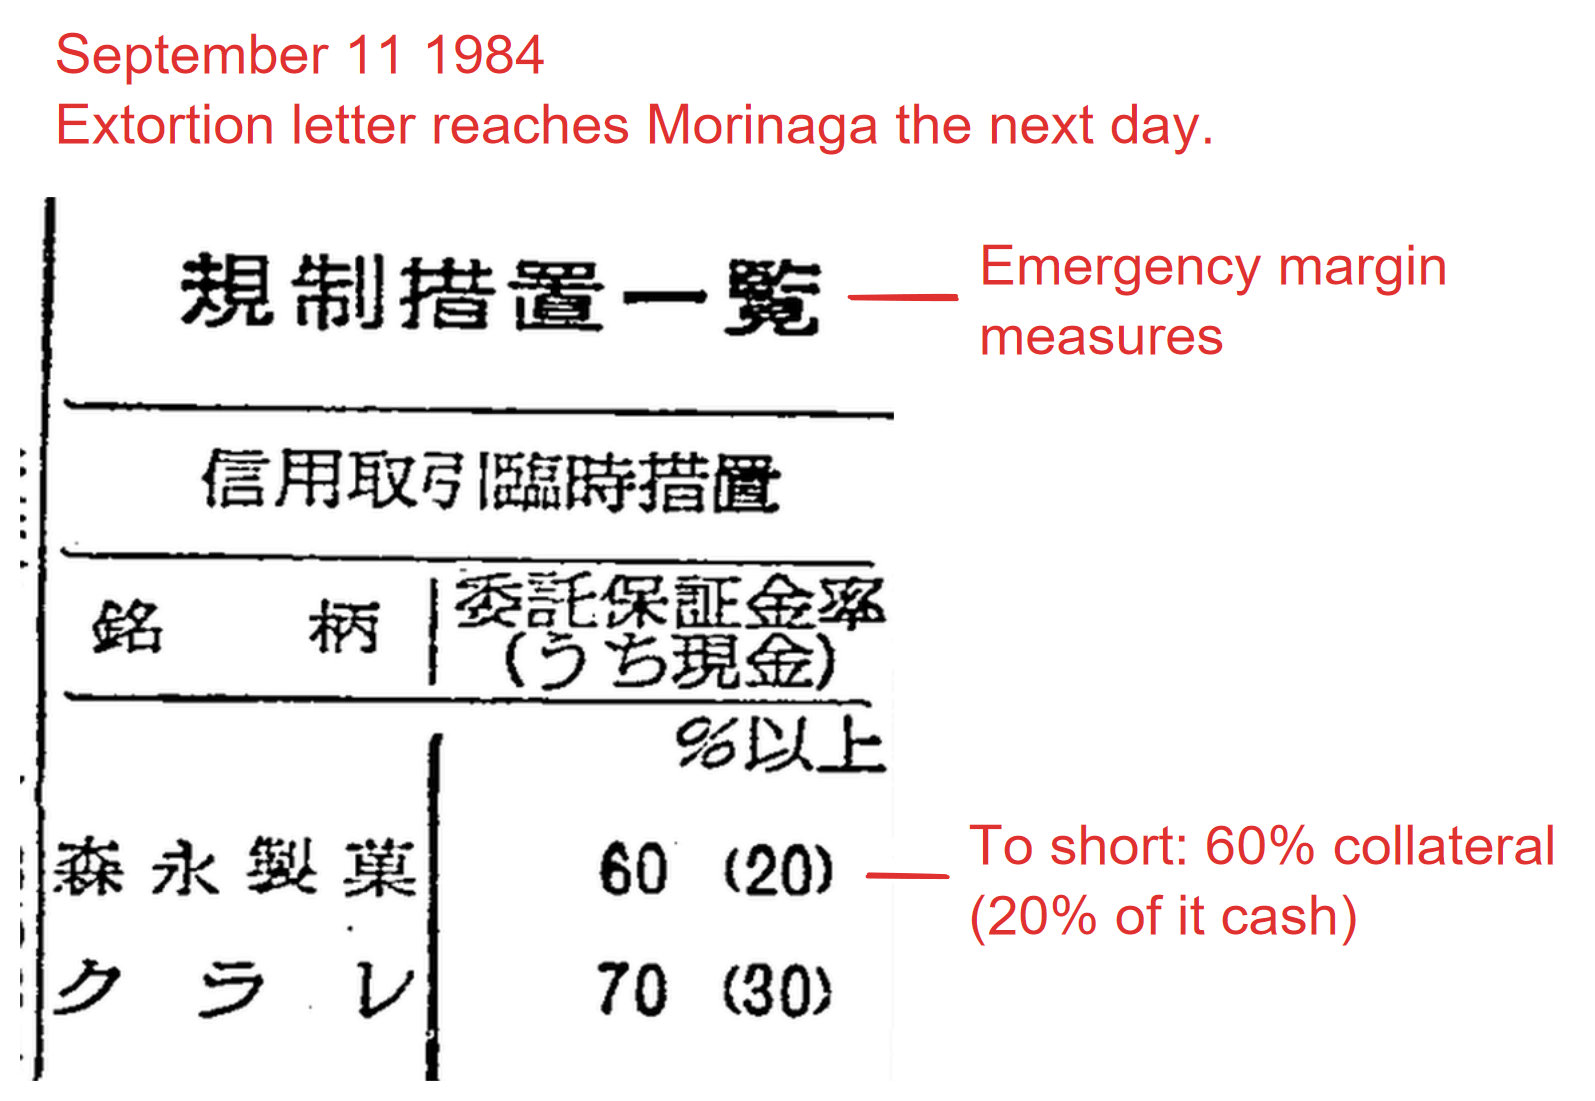
Emergency margin measures: 60% collateral, 20% of it cash, to short Morinaga. Printed September 11, 1984. The extortion letter reached Morinaga’s Kansai office on September 12.14 So the exchange had already clamped the stock the day before the letter arrived; it was reacting to the July squeeze, not to anything the criminals did.
Getting numbers out of the scans
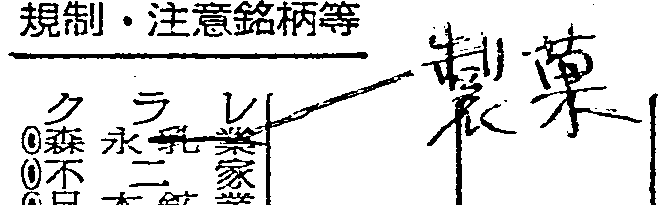
Off-the-shelf OCR is useless on these. Tesseract’s Japanese model reads Morinaga’s name as a different set of characters entirely and invents digits in the price columns. What worked: find each table by template-matching its printed banner, find the columns from the ink itself, cut individual cells, and read the numeric cells with TrOCR on a GPU, which handles degraded print far better than classical OCR.15 Company names never go through OCR at all; they’re matched against reference cut-outs of the printed names and checked against the code ordering, and in stubborn cases I read them off magnified crops myself. The margin balances for the two targets the exchange printed them for, 47 days for Morinaga and 65 for Fujiya, I transcribed by eye.
Even the good OCR output was junk at first. When I computed daily returns from the raw reads, over 90% of the variance was transcription error. A stock closes at 520, the 5 reads as 3, and you’ve invented a 38% crash. So every price goes through a repair layer that models each stock as a slowly moving level and rejects cells that don’t reconcile with it. The convertible bond pages, which print each bond’s parity, give an independent check on a different page of the same paper: where both survive, 83% of the pairs agree within 3%, and the typical gap is a fraction of a percent.
That check still runs my own pixels through my own code. A better one uses data I never touched. The Nikkei 225 daily index for 1984-85 is freely available from FRED, and it has nothing to do with any of this: different institution, different index, digitized decades apart from my scans.16 If my food stocks are real, their daily moves have to covary with the market. Built from raw OCR, an index of my food stocks has a daily standard deviation of 44%, fifty times that of a real index, and a correlation with the Nikkei of 0.076. Run the same construction on the repaired data and it becomes a 0.61% daily standard deviation (the Nikkei’s own is 0.80%), correlation 0.505, and a market beta of 0.384, which is about what a defensive food sector should have. On the five worst days the Nikkei had that year my food index is down every time; on the five best it is up by much less, the way defensive sectors behave. Shuffle the dates and the correlation collapses to zero. How good the numbers are is measured in the appendix, against 33 plates I read by eye. The short version: the raw extractor gets 89% of cells right; the repair layer keeps about half the weekday closes, and 97.5% of what it keeps matches the plate exactly; a single stock’s daily returns carry at most about 1.1% of noise, and the tests below were sized to see through that.
One more thing about method, because everything below is a negative result, and negative results are easy to fake. Several times during this work a finding looked real and died on inspection. The clearest case was House Foods’ morning session. The price tests showed House underperforming in the morning sessions of its concealed window at p=0.011, roughly a one-in-ninety chance of arising by luck, exactly what an overnight-informed seller should produce. It held up until I looked at which days were in the window: it included December 11, the day the press blackout on House lifted, and the morning selling was the public reacting to the news. Move the window edge by one day and the result was gone. Everything below has been through that kind of check, with the window edges fixed in advance.17
The data that came out of all this: daily prices and volume for about 50 food-sector stocks plus a machinery-sector control group, 1981 to 1985; morning and afternoon session returns for 1984; margin balances for Morinaga and Fujiya; the convertible bond market; and the full borrow-shortage record, 472 published days, 14,737 entries, each tied to a name and a fee.
What the theory predicts, and what’s actually there
If somebody traded on the concealed windows, the target should underperform the other food stocks during the blackout, short interest should build, and the borrow should tighten. None of that happens, in any of the windows, at any strength the instruments can see.
Prices: each target against the other food stocks, through its own concealed window, compared with random windows of the same length from the same stock’s history. Marudai’s window is the long one, June to November, 53 usable trading days, and it comes back flat with enough data to have detected a drag of 0.14% per day. The morning-versus-afternoon split, which would catch someone queuing orders overnight, is flat too. Pooling all the windows and hunting aggressively, trying every defensible window edge, the best surviving result is Morinaga’s autumn decline at p=0.09, roughly a one-in-eleven chance of showing up by luck. The margin data explains that one.
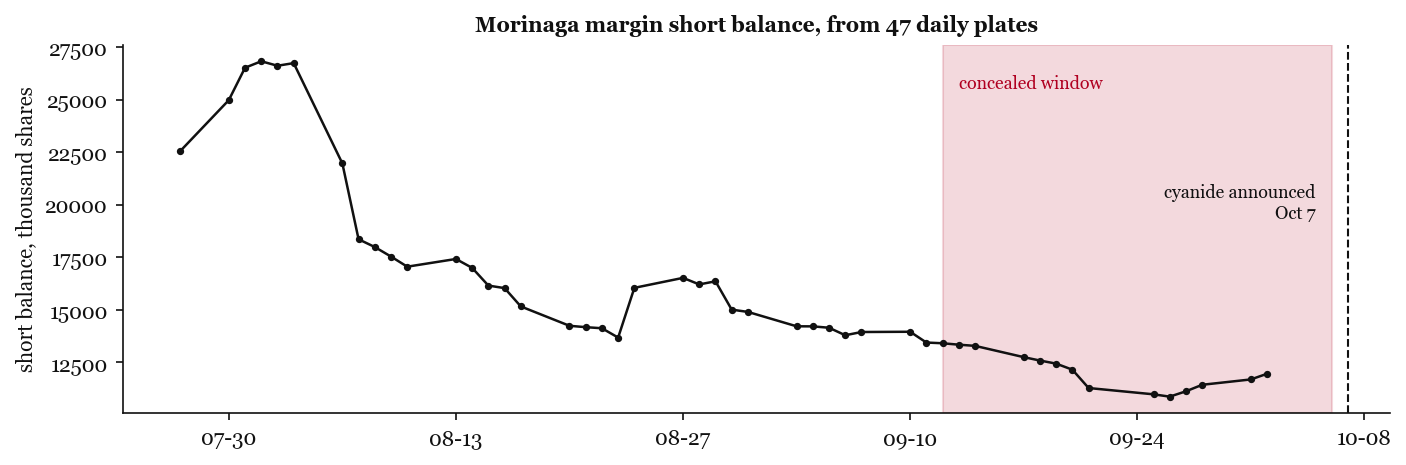
Morinaga was under surveillance, so the exchange printed its short balance daily. Through the concealed window, the weeks an informed short would be building, Morinaga’s short interest was being covered, down from about 26.7 million shares in late July to 11 million by the day the poisonings went public. That is the p=0.09: the stock drifting down while the shorts bought back.
Here is Morinaga’s complete two-year record in the lending-fee table, days listed per month:
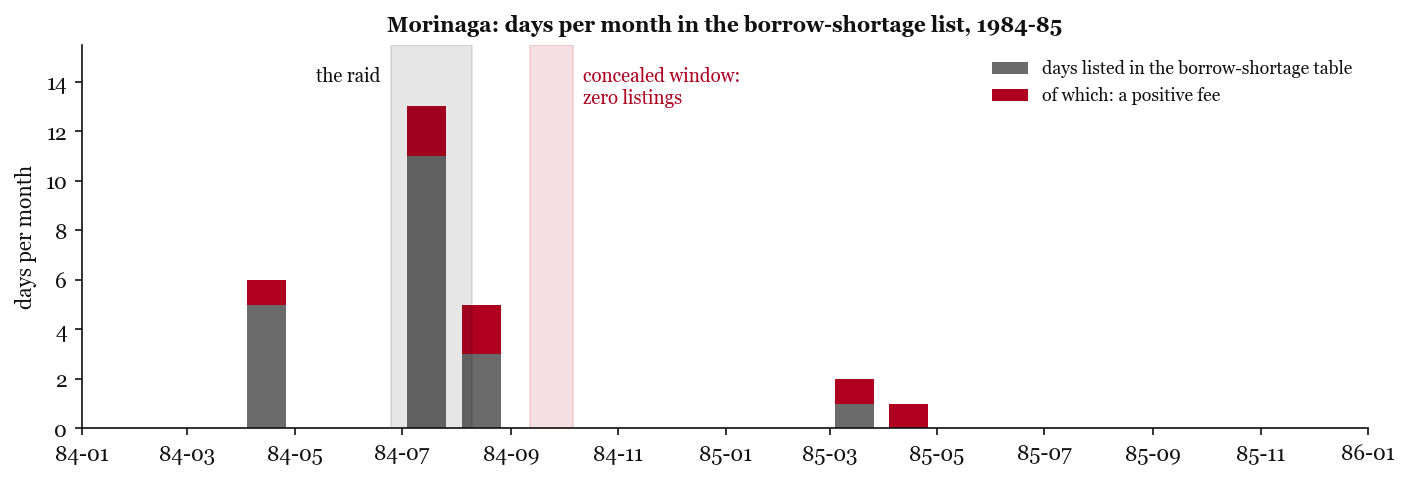
Two things stand out. First, the instrument works. From July 12 to August 6, 1984, Morinaga was in borrow shortage on 17 of 23 sessions (13 of them in July) with the fee going positive three times, the squeeze that earned it the 60% margin requirement in the restriction table above. When shorts crowd this stock, the table shows it and the regulator moves. Second, look at September and October. The concealed window, September 12 to October 6, ending the day before the cyanide announcement: zero appearances in 18 published sessions, against about one expected from the stock’s own base rate, and the planted-signal test says six would have been flagged. October after the announcement: zero. November and December: zero.
Fujiya, same test, its own window in December and January: listed 2 days out of 21, against 7 expected from its base rate. Nothing unusual, though I lean on Fujiya less than on Morinaga. Morinaga’s borrow listings are corroborated by its margin table: on days it’s in the fee list its shorts exceed its longs, on other days they don’t, with no overlap. Fujiya’s margin numbers show no such pattern, so its listings may mean something slightly different, and I read them as no sign of crowding rather than as a second hard no. House Foods never appears in its window at all. There are entries reading “House” in those weeks, but they sit above Ajinomoto (2802) in the code order, which makes them Daiwa House or Sekisui House, the construction companies, codes 1925 and 1928. House Foods is 2810 and would print after Ajinomoto. Marudai appears nowhere in two years.18
For completeness, one price result did survive its checks: the food sector fell about 1.4% against the market on the day reporting of the House extortion resumed. So the instruments do see the public reaction to the news; what they don’t see is anything ahead of it.
The convertible bonds got their own test, because they were the one instrument in 1984 Japan you could trade with real anonymity, no margin account, no printed short balance. You can’t practically short a convertible, so the trade available to an insider is the reverse: crash the stock with your own crime, then quietly accumulate the bond in the panic and ride the recovery. House’s bond, through the exact post-disclosure trough where that accumulation would happen, traded at the bottom of its own volume distribution, less than normal rather than more, with a control that detects a threefold volume increase 96% of the time.19
The one time the money moved
There is a version of the theory that isn’t about shorting at all, and it is the strongest one anyone has proposed. Manabu Miyazaki, a former stock reporter who was himself questioned in the case, argued the money was in a raid: accumulate a big block of the target quietly, run the price up, squeeze the shorts, and then get the company or its friendly shareholders to take the block off your hands at a premium. He put the figure at ten billion yen.20 Every test above is blind to that by construction, because they all look for selling pressure. So I went back and looked for buying pressure, and found the squeeze I mentioned when reading the margin table. In the summer of 1984 Morinaga’s stock went from 305 yen on June 25 to 654 on July 31. On July 30 alone, 41.8 million shares traded (I checked that figure against the plate by eye, since it was the one number big enough to be an OCR error, and it is right), sixty times a normal day and more than a tenth of the entire company in a single session. The borrow went into shortage and the exchange imposed its 60% collateral rule. It has the shape of a raid, and it is the one place in two years of data where somebody unmistakably made a great deal of money in a Glico-Morinaga target.21
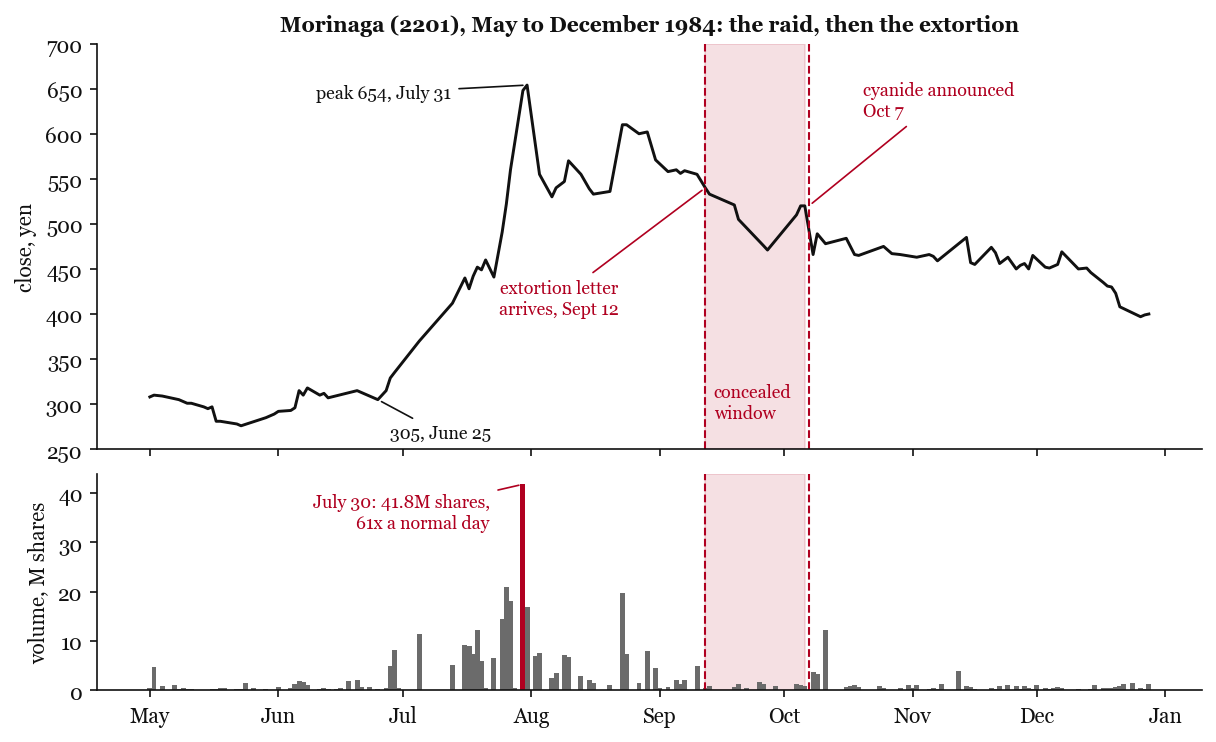
And here is the row on the July 30 price page that the big bar rests on, one continuous strip: code 2201, the name, the morning session’s open, high, low and close, the afternoon’s, then the day’s change (up 70) and the volume cell reading 41780:

How unusual is it? Taking every stock in my 1984 data with clean coverage and measuring each one’s best five-week gain, Morinaga is first of 44, and first again after dividing by each stock’s own volatility: 4.5 standard deviations against a next-best 3.4. Only four of the 44 managed a 50% gain in any five-week stretch that year, and the runners-up mostly peaked in other months, so this isn’t the summer rally showing through. Over the identical window the Nikkei fell 1.7% and the other food companies went nowhere: Meiji down 4%, Glico up 2%, Fujiya down 6%. Two caveats apply. The borrow fee itself was ordinary, 10 to 30 sen, where nearly half of all positive fees that year were larger, so the stock was crowded but not historically so. And my data covers 44 food and machinery names out of roughly a thousand listed in Tokyo, in a year the market rose 17%. It was the most violent move in my data; whether it was the most violent on the exchange that year, 44 names can’t say.
The problem for the theory is the calendar. The raid peaked on July 31 and was already unwinding when the extortion letter reached Morinaga on September 12: shorts had halved, the price was down to 540. The raid was over before the extortion began. And the people who were long on margin never got out. Their balance sat at 24 to 28 million shares straight through the concealed window and into the cyanide crash, from 648 to 466. The crowd that followed the raid ended up as the extortion’s victims. Nor was any other target run up before its own letter: a test on the thirty sessions before each threat comes back flat for all five companies. What market data can’t exclude is a block sale to friendly hands in August, off the exchange, followed by an extortion with some other motive. That is a question for paper records, and they exist: the fiscal 1984 securities reports list each company’s ten largest shareholders, and a new large holder who appeared in Morinaga or Fujiya that year and then vanished would settle it. They’re on microfilm in an Osaka library.22 If anyone goes, I’d like to know what they find.
There is one loose coincidence. Morinaga’s raid starts at the end of June, but its borrow squeeze, the part the lending table records, begins on July 12, the first trading session after the date usually given for a batch of threat letters mailed to several food companies at once, letters that reportedly stayed out of the press until October. The sourcing on those letters is thin, Morinaga isn’t clearly among the addressees, and a date match found after the fact proves nothing.23 But who got the July letters, and when, is the other archive question I’d like answered.
How much money was even in it?
All of the above is absence of footprints, and small trades don’t leave footprints. So the last calculation flips the question and asks how much money there was to make. Assume perfect foresight of every event and of the date each one became public (the criminals controlled those dates, so this is fair), zero market impact, and 1984’s actual trading costs, which were not small: fixed commissions plus a 0.55% securities transaction tax.24 The constraint that remains is volume. You cannot sell short more shares than the market buys from you.
One trade in the list runs the other way. On June 26, 1984 the gang sent a letter saying it was done with Glico (“if we make children cry, that’s trouble for us too; we forgive Ezaki Glico”), and Glico’s shares, down by a quarter since the kidnapping, recovered on the news. Someone who knew that letter was coming buys rather than sells, so that trade is priced as a long.
Run the campaign at 10% of every session’s printed volume, every session of every concealed window, and cover into the panic afterwards:
| event | max net profit | demanded |
|---|---|---|
| Marudai window | ¥39M | ¥50M |
| Morinaga window | ¥19M to ¥40M | ¥100M |
| House window | ¥0.8M | ¥100M |
| Glico forgiveness letter, long | ¥1.8M | |
| whole campaign | about ¥61M | ¥350M or more in cash demands |
(Morinaga gets a range because only 9 of the roughly 17 sessions in its window have usable prices; doubling the printed figure is the generous reading, and it changes nothing below.)
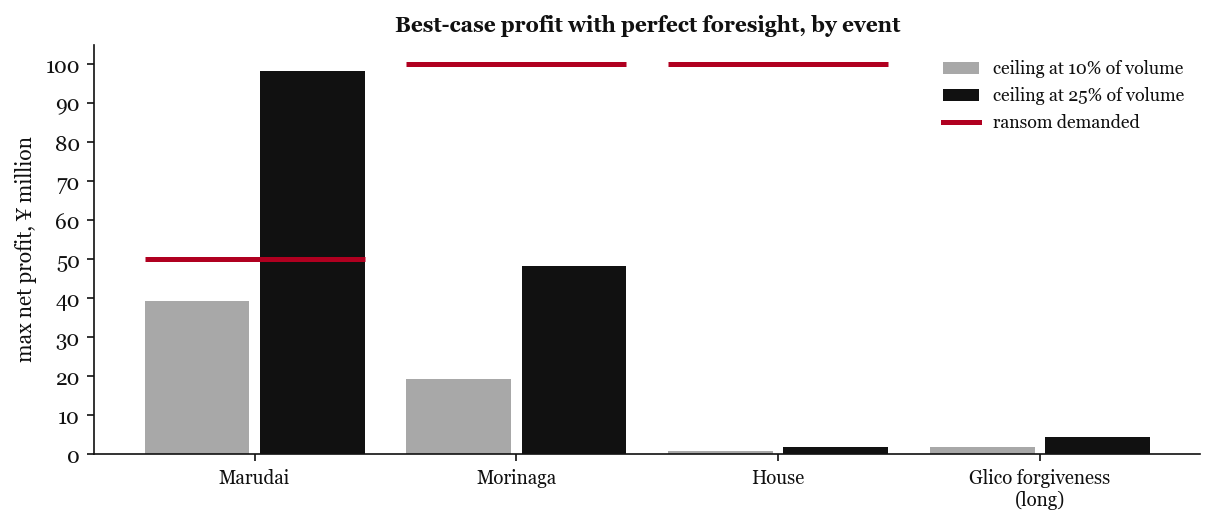
House Foods is the clearest case. The stock traded around 33,000 shares a day, and the most the entire concealed window could have paid, with perfect knowledge and aggressive execution, was about two million yen, against a hundred-million-yen demand.
At 25% participation Marudai’s ceiling does clear its ransom, ¥98M against ¥50M demanded. But 25% of every session for five months in a stock that trades 73,000 shares a day is not a hidden trade; at that size it is the market, and the price tests, the borrow table and the margin ledger would all have shown it. None of them do, and the margin ledger shows the opposite. Put together: the quiet version of the trade could not have covered a single ransom, and the version that could would have shown up in at least three of the records above.
And there was no way around the cash market: no stock index futures in Japan until 1987, no listed options until 1989.25 The instruments you would use to do this properly did not exist in 1984.
What I can’t rule out
The first gap is Osaka. This was a Kansai crime: the offenders worked out of Kansai, the letters went to Osaka newspapers, and four of the six targets were Osaka-area companies dual-listed on the Osaka Securities Exchange, whose 1984 daily records were never digitized.26 I checked: they exist as bound volumes in a couple of libraries, and that’s it. Prices arbitrage between venues, so the price tests and the ceiling arithmetic above cover Osaka fine, and the one stock deep enough for its ceiling to reach ransom scale, Morinaga, was listed in Tokyo only.27 But Osaka’s margin books and its own lending-fee auctions are invisible to me. A modest short routed through an Osaka broker would not appear in anything I’ve shown you. The ceiling arithmetic says such a trade could not have paid ransom-scale money, but nothing here rules out that it happened.
The second gap is small trades. Below roughly half a percent a day of price impact, and below the reporting thresholds, a position is invisible to every instrument here. The only answer to that is motive: such a trade nets a few million yen across the whole campaign, and nobody kidnaps a CEO and poisons store shelves for eighteen months for less than the smallest ransom bag they walked away from.
The third is coverage. January and February 1985 prices are missing (the bulletin changed its print format and broke my column detection; fixable, not yet fixed), so the Fujiya announcement and the last months of the campaign, up to the farewell letter of August 1985, were tested through the borrow record only. The Glico kidnapping window I never tested, because I could not pin down its press-blackout dates well enough to define one. And all of it is OCR of forty-year-old scans, repaired and cross-checked but still a reconstruction.
Verdict
Two years of the exchange’s own paperwork and five independent instruments, and every properly specified test comes back flat. The shorts were covering during the weeks when the theory needs them to be building. The borrow table, which visibly registers a squeeze when speculators pile into this stock, is silent through every window in which the criminals held private information. The convertible bond market showed nothing at the troughs. The one violent move in a victim stock, the July raid, was over before the criminals wrote to the company, and the people who rode it were the ones who lost.
Why the Monster never took the money, I don’t know; nobody does. But the market didn’t pay them, and it couldn’t have: played perfectly, the entire seventeen-month campaign was worth less on the Tokyo Stock Exchange than one ransom drop they abandoned.
Appendix: how accurate is the data
Against 33 plates I read by eye, spread over the whole of 1984 (the original three plus thirty chosen at random: 718 rows, 4,300 price cells), 89% of the price cells the extractor produced are right, and it produced 542 of the 718 rows, so end to end the figure is 69%. The errors are not spread evenly. Four plates have a column-splitting failure in which most cells come out wrong; the other 29 run between 91% and 100%. Those are numbers for the raw read, which the tests never see. What the tests use is the repaired close, and on the same 33 plates the repair layer kept a close for 37% of the stock-days (51% on weekdays; the one-session Saturday rows mostly fail its checks and are dropped). Of the 237 closes it kept, 231 match the plate exactly, five are within 2% (four of them the morning close standing in for an unreadable afternoon cell), and one is wrong by 7%. The four broken plates contribute almost nothing to the kept set, which is the point of the layer: on a bad plate it leaves gaps rather than wrong numbers. Every disagreement between my reading and the extractor on an otherwise clean plate got a second look at double magnification; of ten such cells the extractor was wrong nine times and I was wrong once, and that one is corrected.
How much noise that leaves in the daily returns can be measured directly, because a transcription error in one price hits two consecutive returns with opposite signs and leaves a fingerprint in the autocorrelation. Measured that way, at most 18% of a single stock’s daily return variance is leftover noise, about 1.1% per day, which averages down to 0.16% per day over the longest window I test. The planted-signal test on the same window, a different method entirely, put the detection floor at 0.14% per day. Two methods landing on the same number is the main reason I trust the error estimate.
A random sample can still miss the worst plates, so I also went looking for the plates most likely to be garbage. The pipeline’s own diagnostics (share of cells the repair layer rejected, spread of the day’s returns across stocks, residual against the Nikkei) rank every 1984 plate by suspicion, and I hand-read the three worst. Of 47 closes, the pipeline kept 23: 21 exactly right, the other 2 morning closes used where the afternoon cell was unreadable, 1 to 3% off. It threw away 24, and 19 of those really were garbage. No fabricated value got through; the failures are missing values. One of those plates is July 30, the day Morinaga closed at 648 after closing at 305 five weeks earlier, the peak of the July squeeze. A repair layer that rejected big moves as OCR error would have erased it; this one kept it, because the move came in daily steps of 5 to 8%.
Notes
-
Japanese Wikipedia, Glico-Morinaga case, which cites the contemporary press; English summary on Wikipedia. The letter quotations are as reproduced there. Concealed-window dates in this post end on the last trading day before each public date. ↩︎
-
Edogawa Rampo, The Fiend with Twenty Faces (1936), Wikipedia. ↩︎
-
February 13, 2000. Kobe Shimbun, March 2024. ↩︎
-
From the series built in this post: 512 to 471 yen across the announcement. ↩︎
-
Ichihashi Fumiya, Yami ni kieta kaijin (Shinchosha, 1996), chapter 13. Video Seller was a Suginami raid group founded in April 1982; its chairman, Takahashi Hiroshi, was found dead in his office on October 19, 1985, recorded as heart failure. The company’s dissolved registration is still in the government corporate register. ↩︎
-
Miyazaki Manabu and Otani Akihiro, Glico-Morinaga jiken: saijuyo sankonin M (Gentosha, 2000); Shiota Takeshi, Tsumi no koe (Kodansha, 2016; film 2020); Shikiho Online, May 2025. ↩︎
-
745 yen in January 1984 to 598 on May 17, the comparison repeated in most discussions of the theory. The series built here shows the same move. ↩︎
-
JPX daily market statistics archive: monthly zip files of the scanned bulletin from 1981. JPX asks that the files not be redistributed, so this post shows only small excerpts; every market figure in it is my own transcription from them. ↩︎
-
JPX, trading hours since 1949. Most Saturdays had a morning session only, until February 1989 (Nikkei Indexes). ↩︎
-
JPX, per-issue margin balances, the present-day form of the table. ↩︎
-
Japan Securities Finance on the lending auction; JPX on lending fees. ↩︎
-
As note 1. ↩︎
-
The same test with December 11, 1984 inside the window and without it. ↩︎
-
Daiwa House 1925, Sekisui House 1928, Ajinomoto 2802, House Foods 2810. ↩︎
-
House Foods’ convertible bond, December 1984 to February 1985, against a planted threefold volume increase. ↩︎
-
Miyazaki and Otani (2000), note 6; the figure as reported in the Wikipedia article in note 1. ↩︎
-
No contemporaneous account of the July 1984 move survives on the open web; 1984 newspaper text is not online. ↩︎
-
Osaka Prefectural Library, which holds the reports on microfilm and copies them by post. ↩︎
-
The letters and their October reporting date are as given in secondary chronologies; I found no primary account of who received them. If you have one, I want to hear from you. ↩︎
-
Securities transaction tax on share sales: 0.55% from 1981, 0.30% from 1989, abolished in 1999 (Japan Securities Research Institute, chapter 14). Brokerage commissions were fixed until 1999. ↩︎
-
Osaka Exchange chronology: index futures June 9, 1987; Nikkei 225 futures September 1988; Nikkei 225 options June 1989. ↩︎
-
JPX’s archive carries no Osaka equity data for the period. If you have access to the Osaka exchange’s daily records for 1984-85, I want to hear from you. ↩︎
-
Listing venues from the 1984 exchange annual. ↩︎